


My first post here at MLHS was an Introduction to Advanced Hockey Statistics, which I recommend you go read if you have not done so yet. In it I introduced the concept of WOWY statistics and WOWY analysis in player evaluation. In this post I am going to look into this deeper with examples and explain where and how you can get the data yourself.
What are WOWY statistics?
WOWY stands for With or Without You and essentially looks at pairs of players and how they perform together and how they perform apart. WOWY statistics typically consists of three groups for every pair of players. If we have players P1 and P2 then the three groups are statistics when P1 and P2 are on the ice together, statistics when P1 is on the ice without P2 and statistics where P2 is on the ice without P1. The statistics one looks at can either be goal-based statistics (i.e. goals for/against, goals the player scored, etc.) or corsi/shot based statistics (shot attempts for/against, shots taken by the player, etc.). In theory any statistic could be looked at in a WOWY analysis but the statistics that are commonly available are GF20, GA20, GF%, CF20, CA20, and CF%.
Why use WOWY Analysis?
WOWY is important because good players should be able to make their teammates better. So, if the statistics show that your teammates consistently perform better when they are playing with you than when they are not it is probably a good sign that you are doing something well when you are on the ice. Conversely, if they are performing consistently worse with you than apart from you it is a pretty strong indication that you are holding back your teammates.
Ken Hitchcock, coach of the St. Louis Blues, has mentioned several times that he uses WOWY or WOWY-like statistics to help him identify matchups and players who work well together. In a recent ESPN article Hitchcock mentioned using WOWY statistics (though he did not specificy use the terminology WOWY, that is essentially what he was using).
My [focus] is in matchups and combinations and chemistry,” said St. Louis Blues coach Ken Hitchcock. “I get information on — ‘Is a matchup working or not? Is the chemistry working?’ I get it where you’re starting guys on the ice, is it the right place to start? I don’t get in on all the puck possession stuff. I take pride in understanding that stuff, but I use it on matchups. I use it between periods.
…
“Chemistry is huge. It tells you basically how you’re coaching,” Hitchcock said. “For instance, last year there were three players I played together that I thought had good chemistry. The data showed me otherwise. When I looked back at their shifts, the data was right. I kept putting it back together thinking it was working or would work, but it didn’t work.”
I don’t know where Hitchcock gets his WOWY stats from (my site or internally produced databases) but it is good to see NHL coaches understanding the value in it.
WOWY can be used in player evaluation too. Recently Sportsnet televised a half-hour show called A Numbers Game which they looked at Jake Muzzin of the Los Angeles Kings and utilized WOWY to show that he is probably more important to the Kings than most people might believe. Muzzin is a perfect example of advanced statistics identifying an undervalued and under rated player who probably deserves a lot more credit for his teams success.
Where do I find WOWY numbers?
For this post I am going to use new Leaf Roman Polak as my sample player. I think he is a good example of where a WOWY analysis may have given Leafs management second thoughts when making the trade for him.
The first thing we need to do is figure out how to get Polak’s WOWY statistics. The only (publicly available) source for WOWY statistics is my site stats.hockeyanalysis.com. You can only access WOWY pages through each player’s player page. The easiest way to get to a player page is to click on the ‘Players’ button at the top of the page (see red circle in image below). This will give you a master list of all the players and you can search for. Click on their name to get to their player page.
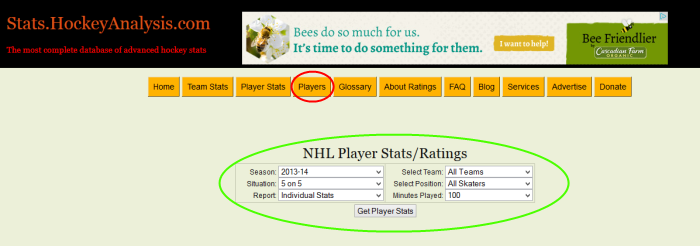
The alternate method to get to a player page is to conduct a player statistics search using the search options found in the green ellipse in the image above. When the search is complete, you can click on any player names within the search results to get to their player page.
Once you get to Roman Polak’s players page, you will find a boatload of statistics; to access WOWY data, you are only interested in the table of links at the top of the page as shown in the image below in the red box:
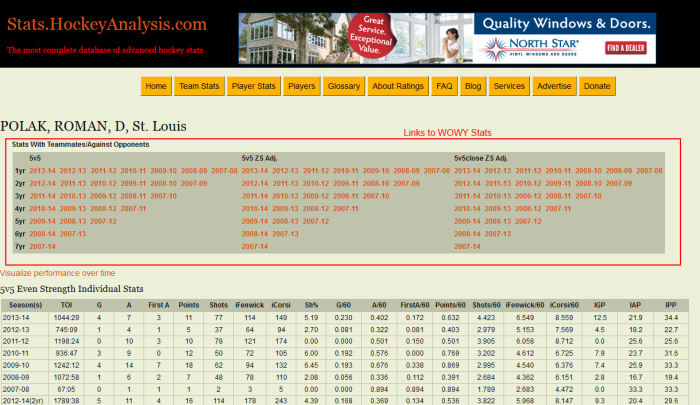
As you can see, there are a lot of links there. I have made WOWY statistics available for 5v5, 5v5 Zone Start Adjusted, and 5v5Close Zone Start Adjusted situations and they are available for every single season or multi-season combination for each of the past 7 seasons. Clicking on 2013-14 under 5v5 with take you to Roman Polak’s 2013-14 5v5 WOWY stats page. At the top of the page you will see the same links to all the WOWY stats as well as a link below it to take you back to the player stats page we just came from. Below this there are actually 3 tables on but the WOWY stats are in the first one, so let’s take a look at that (I’ll get to the second and third tables in a bit).
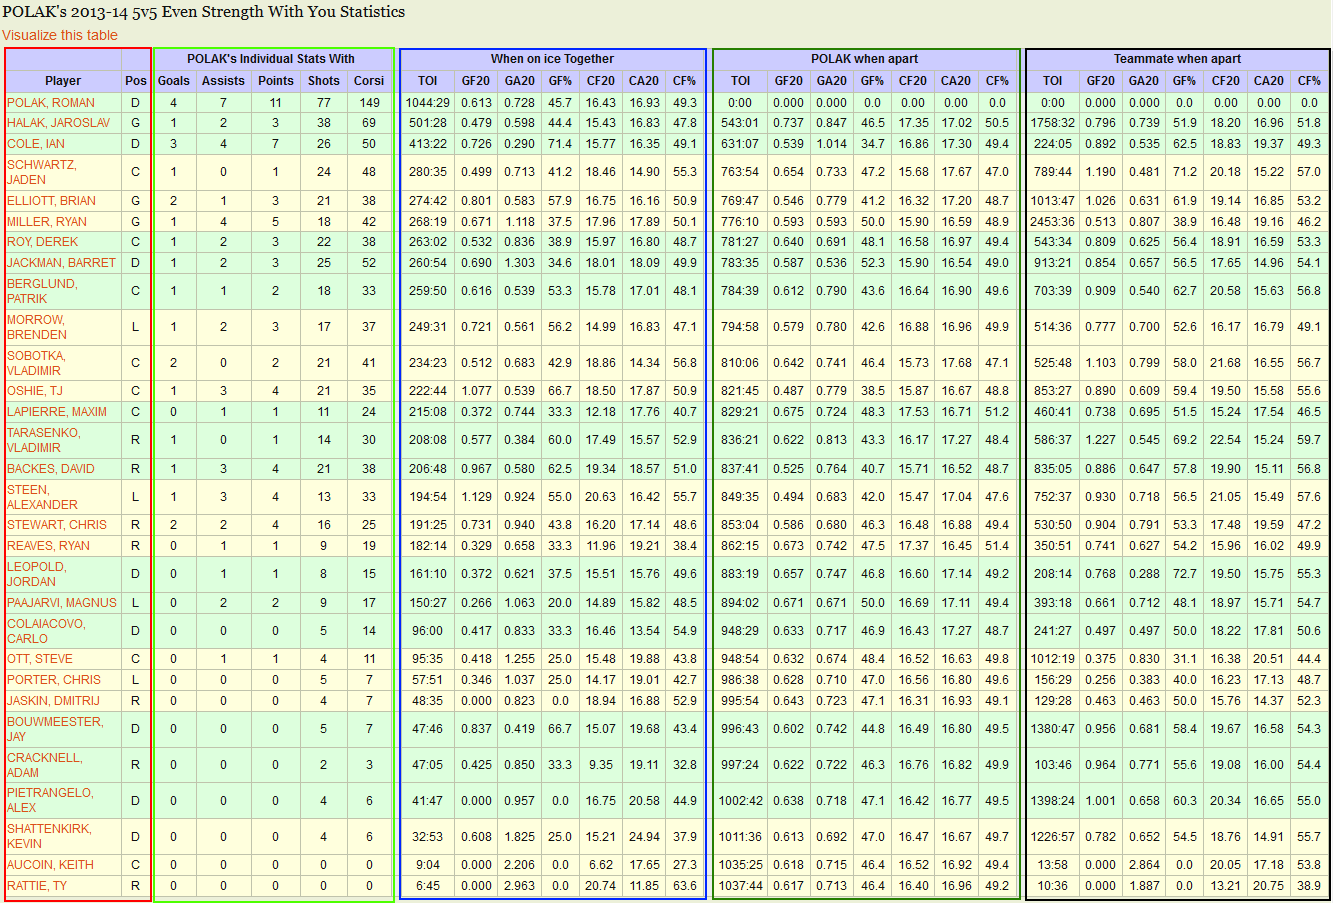
I have put colored boxes around each section to make it easier to explain what each section is. Click the image to get a larger version of it or simply go to Polak’s 5v5 WOWY page for last season to see the real thing.
The red box contains the names and position of every player Polak played with for at least 5 minutes last season sorted by the number of minutes they played together. Note that clicking on any of the players names in this table will take you to their player page, which in turn you can go to their WOWY pages.
The light green box shows Polak’s individual statistics when playing with each particular player. The first row in the table is Polak himself so these are Polak’s overall numbers during 5v5 play last season. He had 4 goals, 7 assists, 11 points on 77 shots on goal and 149 shot attempts. The second row are his stats when playing in front of Jaroslav Halak, while the third row are his statistics with his main defense partner Ian Cole.
While the light green box are individual statistics, the rest of the table are ‘on-ice’ statistics. The blue box are on-ice statistics when both Polak and his teammate are on the ice together. The dark green box holds Polak’s statistics when Polak is on the ice without his teammate. The black box contains his teammates statistics when they are on the ice without Polak.
Let’s take Ian Cole as an example since he was Polak’s main defense partner. The first row shows that Polak played 1044:29 of 5v5 ice time last season. The third row, Ian Cole’s row, shows that Polak and Cole were on the ice for 413:22 together. That means Polak played 631:07 apart from Cole and Cole played 224:05 away from Polak.
So, how did they perform together and apart? Well, together they posted a CF% of 49.1%. When Polak was playing without Cole on the ice with him he had a CF% slightly better at 49.4%. When Cole was on the ice without Polak his CF% was 49.3%. Okay, this is a pretty bad example because they essentially played the same with and apart from each other.
If we jump down several rows to Polak’s second most frequent defense partner Barret Jackman we see a slightly different story. Together they had a CF% of 49.9%, Polak without Jackman had a CF% of 49.0%, while Jackman without Polak was a much better 54.1%. One player does not make a trend, but this would suggest that Jackman is a better defenseman since Polak has better statistics with him and Jackman has significantly better stats without Polak than with Polak.
As I said though, one player does not make a trend. What we want to do is look up and down the list to see if Polak is consistently pulling down his teammates statistics. There are 16 forwards or defensemen who played at least 100 minutes with Polak last season. Of those 16 players, only Chris Stewart and Vladimir Sobotka had a better CF% when playing with Polak than playing apart from Polak. Although I’d still be cautious drawing conclusions about a player based on just one season of CF% WOWY data, this is not making Polak look very good. For a complete WOWY analysis one would probably want too look at multiple seasons and look at GF% data as well (unfortunately for Polak -and Leaf fans- what we see in 2013-14 data is pretty similar to previous seasons as well).
You may have noticed a ‘Visualize this table’ link at the top of the table. This takes you to a series of charts that chart teammates with Polak vs without Polak statistics and I think is a quick way to get a feel of Polak’s impact on his teammates. Here is the CF% chart for Polak’s 2013-14 WOWY stats to show you visually the data just discussed.
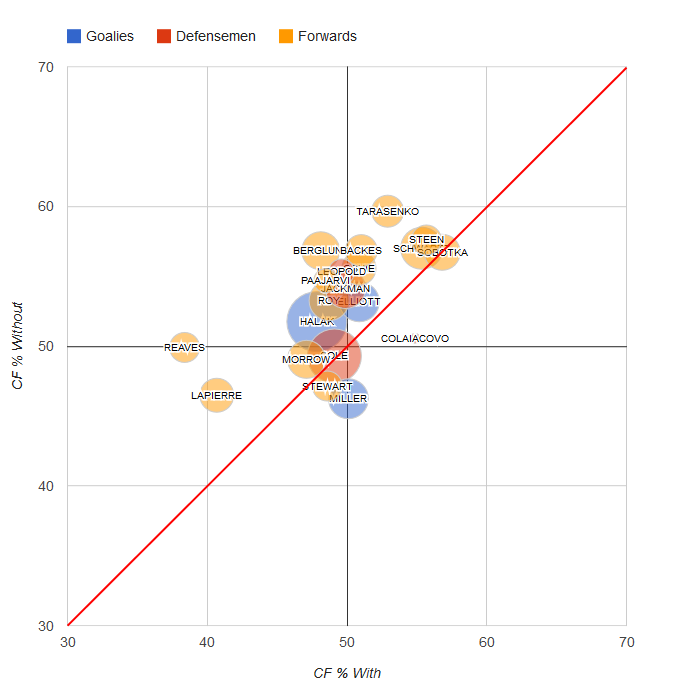
I have added in the diagonal red line to make the discussion easier, but unfortunately you have to visualize this 1:1 line on my site. The 1:1 diagonal line indicates the point where a players statistics are equally good (or bad) with Polak and apart from Polak. If players have a CF% better with Polak than apart, their bubble will be below or to the right of the diagional line. If the players have a CF% worse with Polak than apart, their bubble will be above or to the left of the diagonal line. The size of the bubble indicates the relative amount of ice time they played together (large bubbles indicate more ice time with Polak). As you can see, the majority of the players are to the upper left of the line, indicating they have better statistics without Polak than with Polak. To see that this is a trend continuing from previous seasons, have a look at 2012-13 and 2011-12 charts.
Words of Wisdom
WOWY’s are a useful tool, but one has to be cautious in using them as player usage and other factors may come into play. Some points to remember are:
- Goal WOWY stats (GF20, GA20, GF%) are highly variable due to the relative infrequent nature of goal scoring. Use goal WOWY’s carefully and definitely don’t draw any conclusions from a single season WOWY for goal data. Look for longer term trends. Using 3 or 4 year data can make the goal based WOWY stats significantly more useful and will provide you with much greater confidence in what they are showing.
- Some players play multiple significantly different roles and that can have huge impacts on WOWY’s. Bozak as discussed in an earlier post is an example of this. When Bozak isn’t playing with Kessel he is often just put out there for a defensive face off where if he wins the face off he heads to the bench and if he loses the face off he would typically face shots against. The result is he has very little opportunity to generate shots for and ample opportunity to be on the ice for shots against. The result is his away from Kessel statistics are outright terrible. There are probably not a lot of players who have this significant of an impact but one must take it into consideration. This is of particular interest for face off specialists such as Bozak (or at least perceived face off specialist).
- If every teammate has better stats with a player than apart from that player, it is a good sign that the player is having a positive impact on his teams results.
- Conversely, if every teammate has worse stats with a player than apart from that player it is a good sign that the player is having a negative impact on his team’s results.
The Other Two Tables
I mentioned earlier that there were two more tables on the players WOWY stats pages. These two pages are very similar to the WOWY stats I just described above but are for opponents as opposed to teammates. The first table is for opposition forwards and the second table is for opposition defensemen. These tables are best used to tell you whom a player lines up most frequently against but also show how the players performed when playing against each other. It’s probably less useful than the teammate pages but interesting nonetheless.
TM and Opp Stats
If you browse around stats.hockeyanalysis.com you will see stats with a TM or an Opp in front of them. For example TMGF20 or OppCF20. The TM stats are like a combined WOWY or a summary WOWY stat. TMGF20 is and average of a players teammates ‘apart’ statistics weighted by the time the two players played together. So, for Roman Polak’s TMCF20 for last season it is a weighted average of all of Polak’s teammates apart CF20 (CF20 found in the black box in the WOWY table image above) weighted by the TOI with Polak (TOI found in the blue box in the image above). This is essentially what his teammates do when apart from Polak. Last year Polak’s TMCF% was 0.533 (or 53.3%) which is significantly better than his CF% of 0.492 (or 49.2%). This is consistent with the analysis above that suggested most teammates had a better, sometimes significantly better, CF% apart from Polak than with Polak.
As you might expect, the Opp statistics are similar but are a weighted average of the players opponents statistics. Both the TM and the Opp statistics can be used as a high level overview of the players WOWY and ‘Against You’ statistics and when compared with his own statistics one can quickly assess whether the player is having a positive or negative impact on his teams results.
In Conclusion…
I hope this provides you with an overview of what WOWYs are, what they are used for, and where to find the data. I understand all these advanced statistics can feel a little overwhelming at first, but if you stick with it they will soon all make sense. They really aren’t that complicated, but they do have a bit of a learning curve. Oh, and definitely don’t be afraid to ask questions.
http://stats.hockeyanalysis.com/


