


This article is being co-posted on Maple Leafs Hot Stove as well as on my own site, OriginalSixAnalytics.com. Find me @OrgSixAnalytics on twitter.
As we move past Labour Day and the hockey world turns its attention to the upcoming World Cup and 2016-17 season, a set of narratives have come and gone this past summer – Stammer-geddon, Vesey-gate, and the 2016 draft, to name a few.
In particular, Leafs Nation seems to have shifted its tone slightly. Although most are still quite optimistic about the team’s future, some have also started to call into question the front office’s focus on analytics, its effectiveness at ‘salesmanship’, and more.
Reflecting on some of these storylines, there were a few that I thought might be interesting to test out with some objective, data-based analysis in order to see just how accurate they really are. As a result, this article will be the first of a few in what I will call my ‘Mythbusters Series’. Let’s get into it.
Toronto’s 2016 Draft Picks
The first narrative I will focus on – and one of the biggest coming out of the summer – is the widely alluded-to ‘decreased emphasis on analytics’ coming out of Toronto’s front office. This storyline has come to life in part due to the picks made by Toronto in the 2016 draft, and in part due to (the term and AAV) of Matt Martin’s signing. Although a lot of ink has been spilled over the tradable, four-year contract of a 27 year old — representing 3.5% of the Leafs’ relatively flexible mid-term salary cap situation — today I will just be focusing on the 2016 draft.
We all know the story by now: In the 2016 draft, (i) Toronto picked a bunch of over-age players, many of whom were ‘off the board’ (e.g. unranked/not well known); (ii) Toronto seemed to prioritize height/size this year, and (iii) these two things combine to suggest that ‘analytics’ – and the implicit preference for small, speedy, skilled players – has departed from Toronto’s thought process.
Factually speaking, (i) and (ii) are quite accurate. Five of the Leafs’ picks were over-agers, and eight of their eleven picks were 6’2 or taller. However, what I will question today is the conclusion of (iii), and the idea that targeting size and over-age players suggests anything ‘anti-analytics’ about the Leafs’ front office.
In this article, I will argue there is significant analytical support in favour of the type of player Toronto targeted (e.g. over-age and bigger players in general, rather than the specific individuals the Leafs picked). Further, if any team in any sport is truly trying to be on the ‘leading edge’ and develop innovative approaches to the game, that often might actually require doing things others see as questionable at the time.
Let’s dig into the three reasons why the Leafs’ older/bigger picks may be more supported by analytics than we all think:
1. (Asset Management) Portfolio Theory
First off – let’s talk about size. Most in the analytics community tend to prioritize small, skilled players that can drive puck possession above anything else – and for good reason. However, I also think most can agree that there is some value to (the very different benefits brought by) large, physical players as well. Does ‘conventional thinking’ over-value size, relative to other characteristics of players? Probably. But is there no value to having a physical presence on your team? Probably not.
That’s where the asset management concept of ‘Portfolio Theory’ comes in. In the financial world, diversity reigns supreme. “Don’t have all your eggs in one basket,” sums it up. Put differently, any investor doesn’t want to be too concentrated in one stock, in equities, or bonds, or in any other asset class – lest they find themselves in a situation where that asset class is going to underperform.
After an excellent draft in 2015 and a strong prioritization of bringing fast, skilled players into the organization, the Leafs have arguably reached the point of diminishing marginal returns on that type of player – with an extremely deep pool of forwards in that mould. Portfolio theory suggests that their ‘return on investment’ of their next few 6-foot-plus players – who ideally have some speed and skill as well – will be much greater than picking an Alex DeBrincat-type player, even though guys like Nylander and DeBrincat are hugely valuable in an absolute sense.
The main point here: It should be safe to say that there is some logic to having a supporting cast of size to supplement Toronto’s already strong focus on speed and skill. Especially with a younger team lacking ‘grinder’ type players, the tougher teams in the league would be silly not to make physicality a deliberate part of their game planning against Toronto this year. Compared to some of the observable alternatives (e.g. $6M AAV, 7 year signing of Milan Lucic…), drafting some size seems like a solid idea.
Lastly, what are some of the other, innovative teams in the league with small, skilled line-ups saying on this topic? From Sportsnet:
“In Crouse’s 6-foot-4, 212-pound frame, [John] Chayka [Arizona Coyotes GM] brings size to a club currently more focused on speed and skill in an effort to diversify the type of player the Coyotes are putting on the ice—the “portfolio theory,” he says.
2. Over-Agers as a Market Inefficiency
Second – let’s talk about drafting over-aged players, or those who have ‘re-entered’ the NHL draft. Most of the critics of the Leafs’ 2016 draft found the decision to draft five re-entries as strange unexpected – and likely questionable. Even the analytically-minded crowd seems to see ‘less upside’ to over-agers, despite interesting analysis supporting targeting over-agers as a strategy.
Before we jump to that conclusion, I did a quick bit of analysis to compare the results of players drafted at 18, 19, and 20 years old. A few trains of thought that lead into this chart:
- The top, top players will likely be identifiable when they are young, so it makes sense for most of the picks in the 1st and 2nd rounds to be focused on players in their first year of eligibility (e.g. 18 year olds). You won’t be finding Olli Juolevi or Ivan Provorov in the 3rd round of the draft.
- For any draft pick, the theoretical goal should be to pick players that will be above replacement level, who can add significant value beyond just ‘filling a seat’.
- Replacement level can be defined in simple terms as top AHL players or free agents that can be signed for approximately a league-minimum contract.
Thus, ‘success’ for a draft pick shouldn’t represent a player who just ‘makes’ the NHL but is a 4th line F or 3rd pair D. Those players are available essentially for free in the free agent/waiver market. Rather, success for a draft pick is someone who outperforms that replacement level of production.
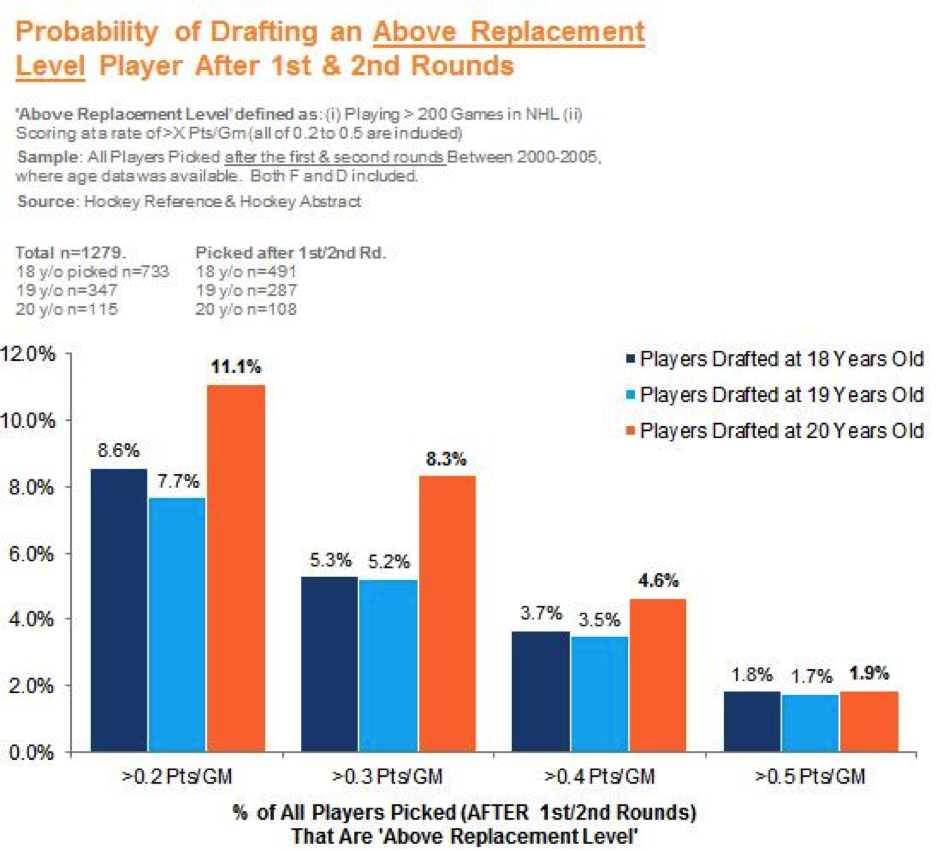
All that said, what exactly is replacement level is very open to interpretation. We should be cautious about using strictly games played as the ‘success’ determinant – loads of 4th liners play 150+ NHL games without adding significant value to their teams, or earning more than single-digit minutes per night. For the purposes of the chart below, I have included only players with >200 NHL games played, and also included scoring rate data, across the ranges of >0.2 Pts/GM to >0.5 Pts/GM.
[wpdatachart id=90]
(Chart not showing? Click here)
‘Above Replacement Level‘ defined as: (i) Playing > 200 Games in NHL (ii) Scoring at a rate of >X Pts/Gm (all of 0.2 to 0.5 are included)
Sample: All Players Picked after the first & second rounds Between 2000-2005, where age data was available. Both F and D included.
Source: Hockey Reference & Hockey Abstract
Total n=1279
18 y/o picked n=733, picked after 1st/2nd Rd n=491
19 y/o n=347, picked after 1st/2nd Rd n=287
20 y/o n=115, picked after 1st/2nd Rd n=108
Note: This data is not adjusted for the rule change with respect to NCAA eligibility and declaring for the NHL draft. However, I believe the impact would be relatively minor.
I won’t go in huge detail into my methodology, as much of it is summarized in the fine print on the chart. In terms of what the chart tells us:
- After the 1st and 2nd Rounds, players drafted at 19 years old (e.g. Draft year + 1) are roughly equally as likely to exceed replacement level as 18 year olds.
- Even more interesting: Players drafted at 20 years old (e.g. Draft year +2) are significantly more likely to surpass replacement level than the other two ages, if defined as >200 NHL GP and anywhere between 0.2 to 0.5 career Pts/GM.
- (Note: To save time, I blended forwards and defensemen in this analysis – though the replacement level definition would of course be very different for each.)
Put differently: If we choose >0.3 Pts/GM as our ‘replacement level’ threshold, over the time period sampled, only 55 players drafted after the 1st & 2nd rounds surpassed the ‘replacement level’ definition. Of these 55, 53% were drafted as 19 or 20 year olds (e.g. in their D+1 or D+2 years) – a huge portion of the players who ultimately were ‘NHL contributors’ to their teams.
As an FYI, I’m definitely not the first person to dig into this subject. Here is a tweet from last June from recently promoted London Knights Assistant General Manager and Director of Analytics, Jake Goldberg:
(10/10) From 1990-2010, 50% of successful forwards picked after Rd 2 were re-entry players. No coincidence the Leafs took 5 of them in 2016.
— Jake Goldberg (@Jake__Goldberg) June 28, 2016
Some may disagree, but I would argue it’s probably a ‘good news story’ for Leafs fans that the rest of the league spent the last five draft rounds focused largely on first-year players who will make up 47% of the ‘above-replacement-level’ pool. Meanwhile, the Leafs spent the 2016 draft significantly prioritizing picking through that other 53%. If that is not taking advantage of market inefficiency, I don’t know what is.
3. Draft Expected Value (DEV)
Finally, just to round out the analytical view that is ‘pro overage players’, let’s give credit to another pair who have done some great work on predicting prospect success: @Zac_Urback and @3Hayden2, and their Draft Expected Value model. I won’t go through every detail of their approach, as they have already summarized it very well in their posts: Introducing DEV, Explaining DEV, Limitations of DEV and – you guessed it – Draft Inefficiencies: Overage Prospects. These guys have rightly got a lot of attention since the draft, so I am happy to pile on.
In short, much like the ‘Prospect Cohort Success’ model created by @MoneyPuck_ (now of the Florida Panthers), DEV generates a list of the most comparable prospects to a particular one, based on age, league, adjusted scoring, and size – in particular, adjusting for whether they are in their Draft Year (D), before it (D-1), or one or two years after it (D+1, D+2). The model then converts that list to an expected NHL result, and then directly assigns a value to a prospect in terms of approximately when he should be picked, and his expected output.
You don’t need to look much further than Zac’s article on Overage Prospects to get an idea of if the Leafs are still putting their analytics team to good use. In it, Zac makes the following point:
“Looking forward to the 2016 NHL draft, I ran the DEV numbers for all draft eligible overage players. One player in particular that I want to discuss is Adam Brooks. Brooks is relatively undersized at 5’10, but in his 3rd year of draft eligibility DEV suggests he’s worth selecting with a pick from 28 – 33 overall. Brooks was valued as a pick from 55 – 82 last year, demonstrating two things: 30 NHL teams passed over a prospect worth selecting in the 3rd round with their late round picks last year, and Brooks has improved considerably since last year.
Some of Brooks’ successful comparables include players like Claude Giroux, Derek Roy, Ondrej Palat, Patrick O’Sullivan, Martin Erat & Jordan Eberle. I suspect he will not be selected as high as DEV values him, but if he’s available in the mid-rounds, Brooks seems like the obvious candidate to draft if a team is looking for a value selection. Obviously Brooks is not a lock to be a successful NHL player, but DEV indicates that he’s just as likely to be an impact NHL player as any other player who is optimally selected in the top of the 2nd round.”
And wouldn’t you know it – in the fourth round at #92 overall – which team selected the small, skilled, but overage player, Adam Brooks? The Toronto Maple Leafs. Mark Hunter and Kyle Dubas seem to right back at it with their old tricks, trying to create value for their franchise.
Conclusion
To wrap things up, I think it is safe to say that the analytics function in the Leafs’ organization seems to still be playing an important role – and doing well to convince their broader organization to make bold, un-loved picks based on statistics that suggest those moves will maximize value. If anything, the TML front office deserves a bit of credit for making their innovative decisions seem like they are not analytically-driven. The only downside of the approach (and to a small extent, articles like these) is that now the TML management team will need to continue searching for the next ‘new’ thing, if they want to keep their edge in 2017.


