When Grabovski got his new 5 year, $5.5 million per year contract, it was met with mixed reviews. You’d be hard pressed to find a Leaf fan who dislikes Grabovski. He’s the hardest worker on the team and puts up a fair number of points. However, it isn’t difficult to be lulled into a sense of disbelief when one learns that Grabovski now makes more than beloved team star Phil Kessel. So how does Grabovski’s contract compare to other players around the NHL and, more importantly, what are his stats in comparison to these players
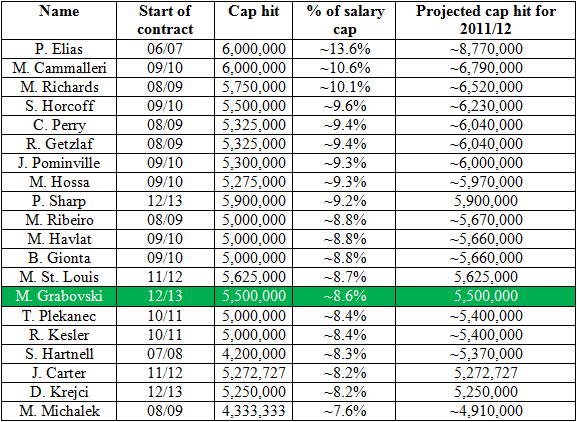
Finding cap hit comparables is not a difficult assignment. Cap Geek has a comparables function built right into their website. So I pulled the names from their list of comparables for Grabovski and inflated their cap hits to 2011-12 money. By looking at the percentage that a player’s contract chipped away at the salary cap when it was signed, you can inflate their cap hit by making it the same percentage of the salary cap in 2011-12. Here’s the list, minus players under 25 and adding a few of my own:
So right off the bat we can see that Grabovski is on the lower end of the spectrum when it comes to his cap hit peers. Some of these contracts are lifetime deals and would be even higher if not for their ridiculous lengths. Now comes the important part: comparing Grabovski to these players to gauge his true value. We’ll start with some defensive stats:
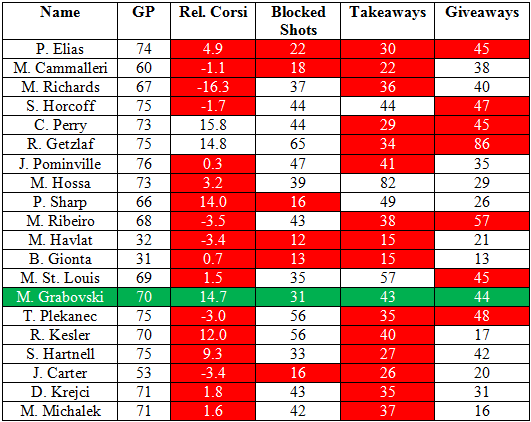
To help the readability, I’ve decided to point out those stats that are worse than Grabovski’s with red. HIs shot blocking totals and many giveaways are by no means impressive, but he’s easily in the upper echelon with regards to takeaways and especially Corsi. Corsi is especially important because of its indication that Grabovski is not only able to get a significant number of offensive scoring chances, but that he’s adept at preventing scoring chances for the other team. The defensively responsible Grabovski we’ve seen this year certainly shows up on the stat sheet.
With that out of the way, let’s take a peek at some offensive numbers:
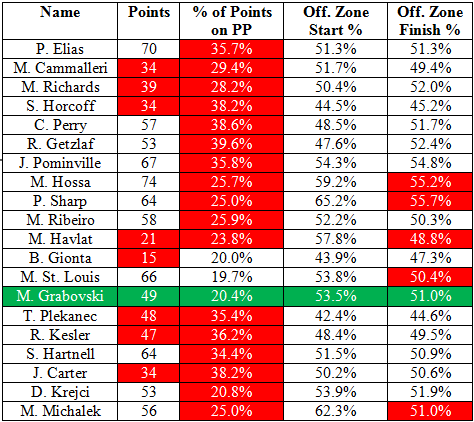
The point totals are not exactly fair for Havlat and Gionta due to their low number of games played, but Grabovski does top a few more. The rationale for making higher powerplay points percentage equal worse stat was that the majority of time, a player is used at even strength. So if a higher percentage of a player’s worth comes at the most frequent time used, that player is more valuable in that regard. Now this doesn’t mean that Grabovski is better than Hossa, it just means that we see his true worth at even strength.
Are Grabovski’s low totals on the powerplay his fault or the fault of the team? It’s difficult to say. However, we can assume that Hossa and Sharp benefit from each other as well as Toews, Kane, Keith, Seabrook and others when on the powerplay. Conversely, Grabovski has spent little time on the powerplay with Kessel this season and has instead been lumped for the majority of the season with MacArthur and Kulemin, two players who are struggling.
For zone starts, I decided not to call any of them worse than Grabovski for two reasons. One, the full implications of its usage are not known to us as of now. Two, the use between coaches is highly variable. The Canucks, for instance, strictly adhere to zone starts, with Daniel Sedin topping the team at 79.6% at even strength. With all of that said, I decided to split the difference between each player’s starts/finishes to compare them to Grabovski.
In this regard Grabovski fell short. However, hockey being a team game means that some stats are more heavily swayed by the team than others. Having played most of the year with MacArthur and Kulemin has no doubt negatively affected his finish percentage. Now it’s time for the final stretch:
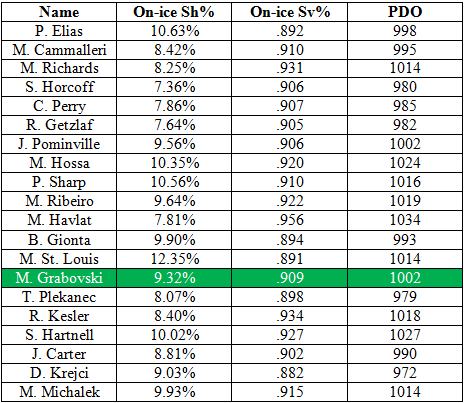
PDO is what can be called a “luck” stat. All it does is add together on-ice shooting percentage with on-ice save percentage. The thinking is that somewhere in the neighbourhood of 1000 is the true value of a player, with lower than 1000 indicating an unlucky year and far higher than 1000 indicating a lucky year. It doesn’t just have to do with points; luck can come in any number of ways. Plus/minus, points, Corsi, offensive zone finishes and others can all be seen as consequences of either your team scoring goals when that player is on the ice or the goalie stopping the puck when that player is on the ice.
For instance, take a look at Jeff Carter. His team shooting percentage and save percentage are both low when he’s on the ice this year. Let’s then consider that most of his season was spent on Columbus, where he was usually passing to bad players and Steve Mason couldn’t stop a beach ball behind him. Then take a look at Milan Michalek. Pushing 10% for shooting percentage is quite high and he’s received better than average goaltending behind him. Expecting regression next year is not a crazy proposal.
Grabovski has a higher than average team shooting percentage and a middling team save percentage. Depending on who is on his line next year will determine his team shooting percentage. In addition, he’s now hitting his prime years (age 27-32 usually) and is likely to be much better the next few years as an individual player. If Toronto can find an adequate goalie next season, Grabovski’s PDO could skyrocket.
The bottom line is that Grabovski’s cap hit is just fine. He compares very favourably to those around him cap hit wise and in fact is clearly better than a few with projected cap hits that are higher than his. Burke has had some difficulty with contracts in the past (did someone say Colby Armstrong?) but I believe he did a fine job with Grabovski. Now they just need to add some pieces to surround the ones they have.


