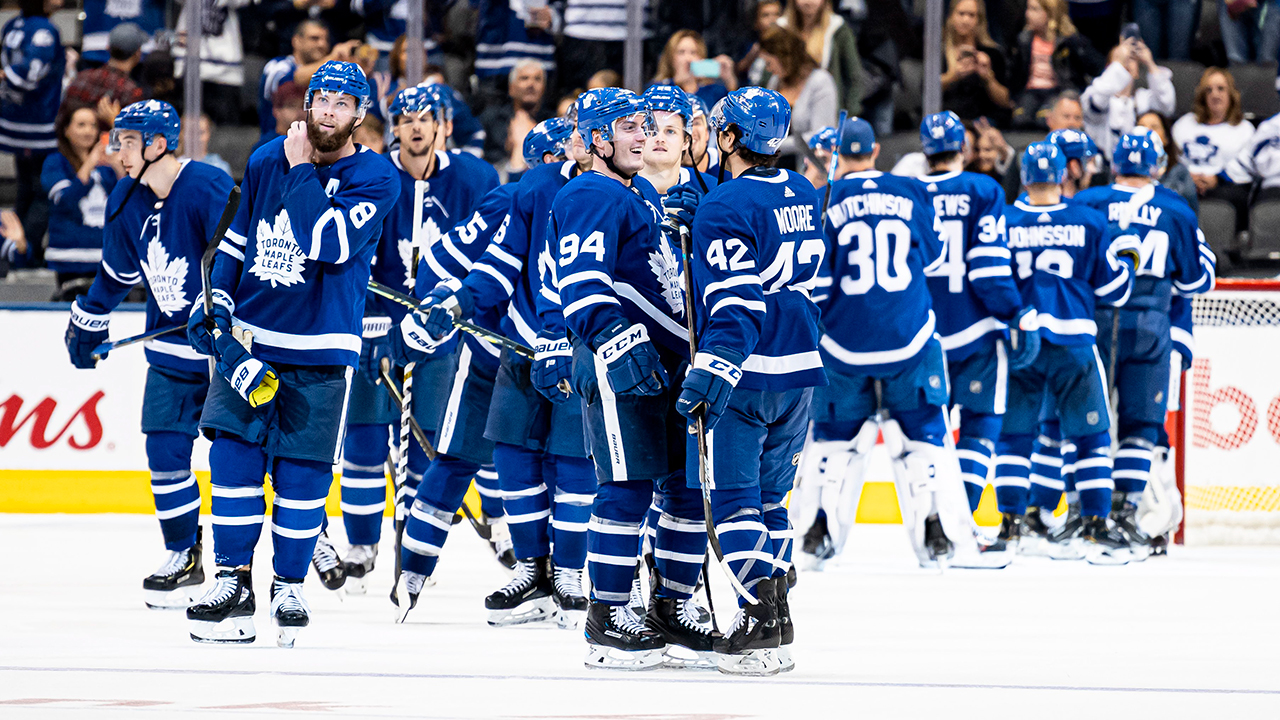
With the regular season now 20% over, the Toronto Maple Leafs sport a 9-5-3 record and sit in ninth place in the league standings.
We are watching a team still developing its identity while recovering from key injuries to their top line, not to mention one of their most promising young defensemen in Travis Dermott.
It’s also been a time of player evaluation in the bottom six upfront and on the third pairing on defense as the Leafs prepare to cut the roster down to 21 men once Zach Hyman returns next week.
That means this is a good time to check in with some charts and statistics on the team’s overall and individual performances before we enter the next stage of the season.
Goaltending
Rather than talk about wins and losses (which are really a team statistic), the thing that matters most to me is how a goalie is performing relative to the shot quality he faces. That is usually measured by expected save percentage.
I was critical of Andersen to start the season; he wasn’t sharp, fumbled rebounds, and allowed too many marginal goals against. As we expected, though, November Freddy has started to round into form.
Andersen with the flashy glove save. pic.twitter.com/rDIjvfUkiF
— Flintor (@TheFlintor) November 3, 2019
After 13 games, his expected save percentage on unblocked shots is 95.10% and his actual save percentage is 95.04%. In other words, he has climbed back to a respectable “average” level despite an inconsistent October.
Andersen’s save percentage at 5v5 continues to climb as well:

If you look closely, you will see the other Atlantic Division teams in the background (I know everyone is saddened at the recent decline in the Bruins’ save percentage).
The Backup
I believe this is the Leafs‘ regular-season Achilles heel. One fallout from the Mitch Marner overpayment (approximately $1.7M above what I stated was reasonable in April) is the lost opportunity to acquire a better but more expensive backup. The team can barely afford a 21-man roster, let alone a backup goaltender who earns much more than Michael Hutchinson’s $700,000.
Hutchinson hasn’t performed terribly for a $700K backup, despite his 0-3-1 record. He is running at -1.1% below his expected save percentage. Playing the second of back-to-back games has meant he’s had a more fatigued team in front of him. Notice how the team’s expected goal share (xGF%) in those back-to-back games dropped off:

Forwards
The best way to describe the Leafs‘ forward lines this season is “mishmash”. The Matthews line was the only stable line as fourth line candidates were rotated in and out and the team dealt with the absences of both Zach Hyman and John Tavares from last year’s top line.
Losing Tavares was a big deal. It meant centers like Alexander Kerfoot and Jason Spezza were moved up into more challenging roles, and a right winger in Kasperi Kapanen was asked to replace Zach Hyman on left. While Kerfoot proved he could handle the challenge, Kapanen struggled and was moved back to the third line.
Goals
Despite the instability, the team ranks fifth in goals scored (57), led by Auston Matthews (13) and Alexander Kerfoot (5). Now in his fourth season, Matthews is currently tied for second in the Rocket Richard race after using his laser pointer to rocket one into the upper right corner against Vegas on Thursday night.
AUSTON MATTHEWS 🚨
Leafs finally score on the 6th PP. What a bullet. 1-1. pic.twitter.com/LGtEQYHqIp
— Flintor (@TheFlintor) November 8, 2019
If you want to investigate other Leafs statistics, here’s the link for this “Maple Leafs Report,” which I plan on updating on Mondays throughout the season.

There are a few surprises here. Newcomer Kerfoot (5) has continued to score despite minimal power play time and the same goes for his rookie linemate from the KHL, Ilya Mikheyev (4). Scoring among the top nine has been very balanced. Anything from the fourth line is gravy, but they’ve chipped in a few as well.
Shooting
Overall, the team has a respectable 10.5% shooting percentage, good enough for 10th in the league. Shooting percentages tend to regress to the average over time and keep in mind this is a small sample of games (especially for some of the less used fourth-liners shown here).
This shot map down below shows every unblocked shot attempt by Leafs forwards this season — red is goals, yellow is misses, and green is saves. The size of each bubble is linked to its expected goal value, so a shot five feet in front of the net has a much higher xG than one from the blue line, which has closer to a 1% chance of going in.
To the right of the rink, you can see some statistics. The Leafs forwards have a shot percentage of 13.19, which is above league average (11.69%), and 6.7 surplus goals over expected as a result. Their shot distance is a little further out than the league average
(28.8 vs 27.5 feet) and their missed shot rate is a little higher as well (29% vs 25%).
Despite the increased distance and lower on-net accuracy, the actual shooting percentage is above average and these “extra” goals (whether talent or luck) have contributed to the W/L record despite weaker goaltending. Of course, Auston Matthews is involved here.
 The chart below ranks each forward’s shooting percentage.
It’s worth noting that Nylander’s shooting percentage (10.5%) has returned to a normal range after a slump last season (5.3%).
(I still have my doubts that at age 23 Nylander will ever be an elite shooter, but that’s another story.)
At the other end, Mitch Marner is probably due for a few more goals given his current 8.3% conversion rate. I would still like to see more of a shooting threat from him on the power play.

Points
Matthews also leads the team currently in points (19) followed closely by Marner (18). They currently rank 11th and 12th on the NHL leaderboard.
If there is a surprise, it’s Mikheyev’s 11 points to date. He’s been impressive, and although he is 25, it’s noteworthy that he sits second in the NHL rookie scoring race. Nylander is tied for third in points with 11 — a 55-point pace, but I am still expecting something closer to a 65-point season from Nylander.

Expected Goal Share (xGF%)
An important point: The Leafs’ ability to tilt expected goal chances in their favour has dropped off this season. I will touch on that later, but looking at on-ice 5v5 xGF%, it’s clear to me that William Nylander has helped refocus the Matthews line in a positive way.
Seeing Matthews and Nylander near the top of this xGF% ranking is good news. This is also the highest xGF% Matthews has had in four seasons. One other contributing factor may be Babcock’s switch in philosophy of placing his top line’s zone starts in the offensive zone more often.
I think this chart is the right time to point out that the fourth line has had some difficulties, although to some degree, it should be expected given their increased role in taking more defensive faceoffs and harder matchups.

Defencemen
I’m going to focus on RAPM metrics here, although Morgan Rielly deserves a special acknowledgment for recording 16 points in 17 games despite recovering from some mystery ailment that has kept him out of practices.
Skip this intro if you already understand RAPM charts.
RAPM Charts
I think Evolving Hockey’s RAPM charts are probably the best way to try and decipher how the Leafs defensemen are doing.
RAPM stands for “Regularized Adjusted Plus Minus.” It’s not easy isolating defensemen when a five-man unit is playing, but techniques that look at all ten skaters on the ice at the shift-by-shift level and use special regression methods to isolate each player’s contribution to shot, expected goal, and goal outcomes are probably the closest current hockey analytics can get.
Nothing is perfect, especially with just a 17-game sample, but I believe they are an improvement on focusing just on the handful of plays or mistakes that our eyes catch around rare goal “events.” This is especially true when you consider that most top-four defensemen have already played over 400 shifts.
In the charts below, each player has five “RAPM’d” indicators, three are offense: Goals For (GF/60), Expected Goals For (xGF/60), and Shots For (CF). Two cover defense: Expected Goals Against (xGA/60) and Shots Against (CA/60).
The vertical axis shows how far a player is above (+) or below (-) the average, measured in standard deviations. You should expect about 2/3 of players to fall within +/- 1 standard deviation and 95% to fall within +/- 2 standard deviations.
Rielly – Ceci

I think the takeaways for Rielly – Ceci are simple: They both provide offensive contributions above an average defenseman and both have defensive weaknesses.
Ideally, Rielly would have a partner who could help cover the defensive side. That isn’t Cody Ceci’s strength, but when you successfully trade away Zaitsev’s contract, you don’t get to pick and choose.
As for the chart, Morgan Rielly allowed an unusually large volume of shots against (CA/60) this season, but he is roughly average as far as adjusted expected goals against per 60. Cody Ceci, now playing with a much better partner and teammates, shows above-average support to shots and expected goals on offense but is moderately weak on both defensive measures.
As analysts like Ian Tulloch have noted, the defensive issues of the pair could be linked to skills such as zone-entry prevention. Others have noted mental mistakes, one as recent as last night where Ceci cleared the puck across the crease to a Vegas Knight for a goal against.
Personally, I think what you see is what you get: The pair comes out a net positive on critical two-way metrics like xGF% once you factor it all in. You can also whisper it now: “Ceci is doing better than most expected.”
Muzzin – Barrie
 I won’t go into the same detail here, but if we focus on the xG RAPMs, you can see that both players are actually in the negative and Tyson Barrie is allowing way too many expected goal chances against (xGA/60).
Most are aware of Barrie’s history of defensive issues but expected a strong offensive showing to counteract them. Right now, he is well below average on the xGF/60 RAPM. That is worth monitoring.
If Barrie cannot generate and support offensive threats, the second pair is going to have a long season.
Last night, I watched Barrie uncharacteristically ice the puck with a lazy pass attempt. Those type of plays add up. I think Barrie is too elite of an offensive defenseman to be in the doldrums too much longer, though.
Dermott – Holl

Travis Dermott has now returned and even his first 40 minutes look good. If he continues like this, he represents a real option to plug any holes in the top four (although I would expect his numbers to weaken against top competition).
Justin Holl, meanwhile, must have really put in the work this past summer. Once seen as an offensive mobile defenceman who could play top pair for the Marlies before ending up in Babcock’s doghouse, Holl has emerged as a solid defensive option. He’s shown that he can physically battle for the puck and shove forwards out of the net front. He also seems to understand his role much better in the Leafs defensive zone, which includes zone positioning and switch offs. I’m not sure what his limits are higher in the lineup, but I suspect we may find out sooner than later.
Special Teams
I wrote about the Leafs special teams the other day, and not much has changed, although the penalty kill stopped Vegas cold on five attempts. The Leafs have issues here — they’re currently ranked 21st on the power play (17.2%) and 24th on the penalty kill (77.4%).
These heat maps at Hockeyviz.com below illustrate the power play’s inability to get more close-in scoring opportunities (the brown areas = more shots than NHL average, the blue = fewer). The dark blue area in front of the net on the PP points to a theme lately: The Leafs need to get more shots from in-close, whether rebounds, tips, or plays like Tavares made last year.
On the penalty kill, the “blue” area has shifted out to the right a little more (Ceci and Holl play the right mostly), and the excess shots are being taken right at the net.


Overall
The Leafs rank 6th in shot share (52.1 CF%), but 21st in expected goal share (xGF% = 49.3%).
That is a sizeable gap and it means they are taking a higher volume of low-danger shots and not getting to the high-danger area often enough. If there is one thing I would like to see in November, it’s a return to shot discipline with Hyman and Tavares back and a tightening of defense in the slot and crease area near Andersen.
A healthy Tavares is a one-man xG machine, but the Leafs need to turn this xGF% trend around. They can’t depend on Andersen every night. You can explore more trend stats at my Rolling Trends viz here.
 I believe the Leafs can get a boost by returning to those greasy areas where a lot of goals happen. This heat map by Hockeyviz.com helps show how their close-in shots are lower than the league average (the red area next to the crease).
Summary
The Toronto Maple Leafs have emerged from a volatile October relatively intact and are now on a 101-point pace. They’ve reached this point because of strong performances from players like Matthews, Marner*, Nylander, Kerfoot, Mikheyev, Rielly, and Muzzin (*not yet at 5v5).
They have other players like Kapanen and Andersen who struggled early but appear to have returned to form, while others like Tyson Barrie are still trying to find their game on a new club.
There have been pleasant surprises, from Ilya Mikheyev and Alexander Kerfoot, to Justin Holl, and even — to a degree — the unwanted child, Cody Ceci.
The team now needs to take the next step and focus on improving its special teams, its ability to work towards more high-danger scoring chances, and a tightening of its top-four defensive play.


![New Leaf Anthony Stolarz on the opportunity in Toronto: “In Florida, I knew my role as a backup… Now, [Joseph Woll] and I are competing for starts… As a goalie, that’s all you can ask for” Anthony Stolarz, Stanley Cup win, now Maple Leaf](https://mapleleafshotstove.com/wp-content/uploads/2024/07/anthony-stolarz-sc-100x70.jpg)
