


The Maple Leafs just surpassed the quarter pole of their schedule with a win over the Detroit Red Wings in game #21 of the 2014-15 season. Last week I looked at how individual players are performing. This week, let’s take a look at how the team is performing as a whole.
It has been a bit of a roller-coaster season to say the least, especially the past 8-10 days. A mediocre start — 2-3-1 in their first 6 games — turned for the better in a big way as the Leafs went 7-2-1 in their following 10 games. Then, everything went haywire: They lost their next three games, two of them in an embarrassingly bad way, including a 6-2 loss to the league’s worst team in the Buffalo Sabres and a 9-2 loss to the Nashville Predators (who haven’t scored more than 4 goals in any other game). In true inconsistent Maple Leaf fashion, they followed up those two embarrassing losses with two big wins against a pair of good teams in Tampa Bay and Detroit.
Despite the season being all over the map in terms of consistency, after 21 games the Leafs sit at a respectable 11-8-2 record. This is behind their pace of last season after 21 games (13-7-1), but it still puts them in the middle of the playoff hunt.
What about the underlying numbers, though? How do they look? We saw that there weren’t too many surprises at the player level in my post last week, so does the same hold true at the team level? To investigate, let’s look at some charts comparing the first 21 games of the 2014-15 season with Toronto’s full-season results from the past three seasons. Let’s start by looking at 5v5 GF/60 and 5v5 GA/60.
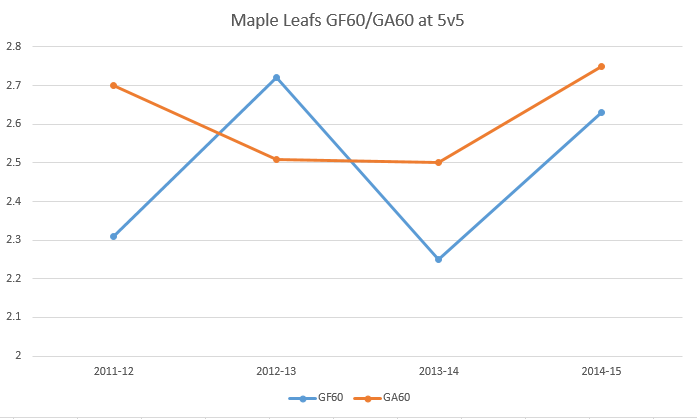
Both GA/60 and GF/60 have risen from last season, although the increase in GF60 is more significant, meaning the gap has closed. That said, the Leafs still have a negative goal differential at 5v5, which is troubling. How about Corsi?
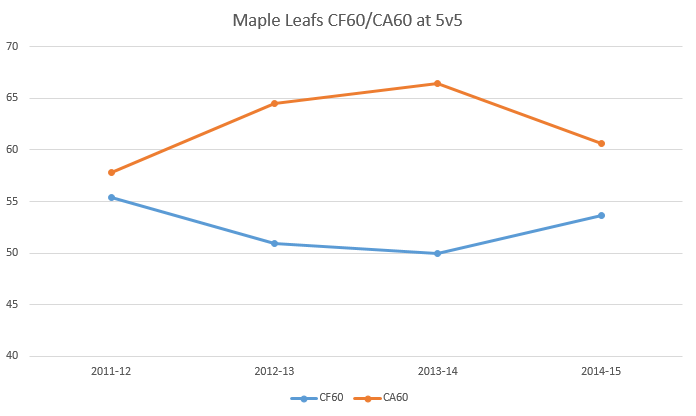
This chart is all good news for Leaf fans. The Leafs have, thus far, reversed a trend of increasing shot attempts against and decreasing shot attempts for. Bringing in some good Corsi players like Winnik and Santorelli and getting rid of some poor ones like McClement and Bolland are probably the most significant factors here. All that said, the decrease in shot attempts against has not resulted in decreased goals against rate. Is this due to bad luck or is something else happening here? More on this in a bit; let’s look at GF% and CF% first.
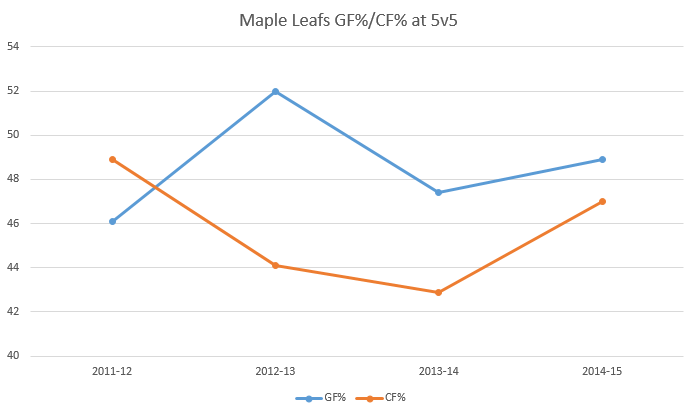
Here we see the Leafs overall goal and Corsi differential expressed as a ratio. In both cases the Leafs are below 50%, leaving ample room for improvement, but in both cases the situation has improved from last season. All in all, there are some positive signs thus far this season.
Next, let’s look at the percentages, which is where things may get a little more troubling for Leaf fans, particularly with save percentage.
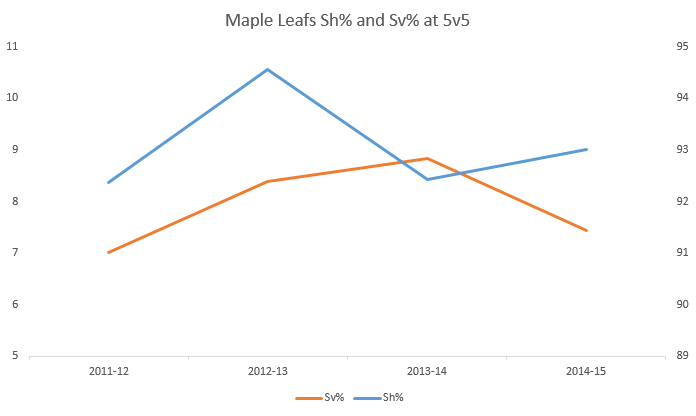
Although I expressed doubts that the Leafs would be able to maintain an above average shooting percentage, thus far they seem to be doing so, even showing a bit of an improvement over last season. That said, in last week’s article I identified several players (Winnik, Komarov, and Santorelli specifically) who had on-ice shooting percentages well above their career averages; I still wonder if their current shooting percentage is sustainable. Time will tell.
With respect to save percentage, the teams overall 5v5 save percentage has dropped significantly this year to 91.43% from 92.84% last year. Is this unusually low or should we expect a bounce back? To answer that, let’s look at this shocking chart comparing changes in CA/60 with changes in Save%.
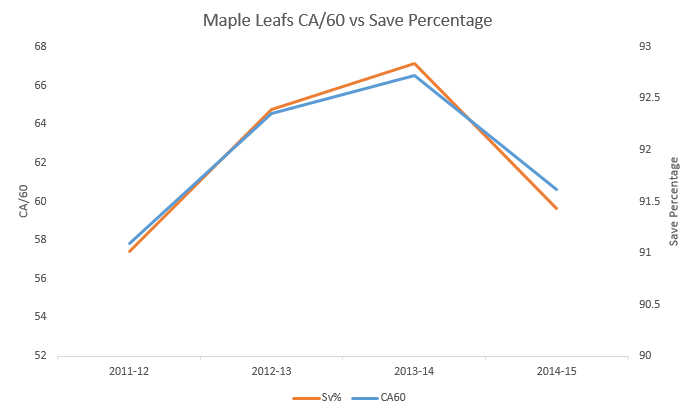
The chart is shocking due to the incredibly high correlation (r^2=0.99). Over the previous 3 seasons, the Leafs saw their team 5v5 save percentage increase in lockstep with their corsi against rate. Now, as their corsi against rate improved this season, their save percentage has declined in lock-step. I have charted a tonne of hockey stats over the years and it is incredibly rare to ever see a chart so ‘perfect’ as this one above. Hockey analytics is typically messy and incredibly uncertain, so when I see a chart like above it really stands out.
So, what is this telling us? If we assume that goaltenders are not a factor (they are, but let’s assume not for now, or at least we’ll assume the quality of goaltending talent hasn’t change significantly for the Leafs over the past 4 seasons), it is telling us that it is possible to give up more shots but of lower quality (easier to save, thus a higher save percentage). It seems that teams can impact shot quality against.
Let’s look at the opposite side of the game and see if the Leafs’ shots attempts for is in any way correlated with their shooting percentage.
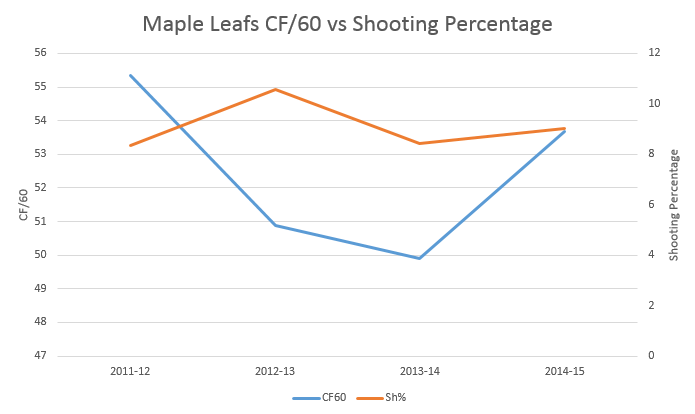
It’s difficult to see here, but there is in fact a bit of a negative correlation (with r^2=0.13).That is not all that surprising given the Leafs forward group has undergone a significant overhaul the past four seasons, affecting the underlying shooting skill. There may be nothing to any of this, but we can find similar trends for other teams, especially those with relative stability over the years.
For the Kings, the r^2 between CF60 and Sh% is 0.57 and the r^2 for CA60 and Sv% is 0.55. The Bruins are 0.79 and 0.32 if you include the past five seasons. The Rangers are 0.83 and 0.54 over the previous four seasons, excluding this season. There may be a dynamic between shot quantity and shot quality that needs more exploration, but certainly the chart of the Leafs CA/60 and Sv% above is interesting.
On a final note, in the summer I did an investigation into rush shots where I identified a shot being rush shot based on whether an event (faceoff, shot, hit, etc.) had recently occurred in the opposite end or neutral zone. I determined that rush shots are generally more difficult shots: Players scored on 9.56% of rush shots and just 7.34% of shots that we cannot conclusively determine to be shots on the rush from the game logs.
What is interesting is that the percentage of the Leafs’ shots against that are rush shots has skyrocketed so far this season. The past three seasons saw 22.8%, 19.3% and 23.8% of all shots against coming off the rush. This season, that has sky rocketed to 28.9%, and they’re on pace to give up about 13% more rush shots this season despite reducing the overall shots against. This likely means Leaf goalies have faced a higher quality of shot thus far this season which likely explains (at least in part) their drop in save percentage this year.
To summarize, we can definitely observe some positive improvements in the Leafs first 21 games this season, most notably reducing the shots attempts against and boosting the shot attempts for, although there is definitely still ample room for improvement. On the downside, it seems the Leafs are still giving up a number of higher quality rush shots against, indicating they are still far from a defensively-reliable team.


