


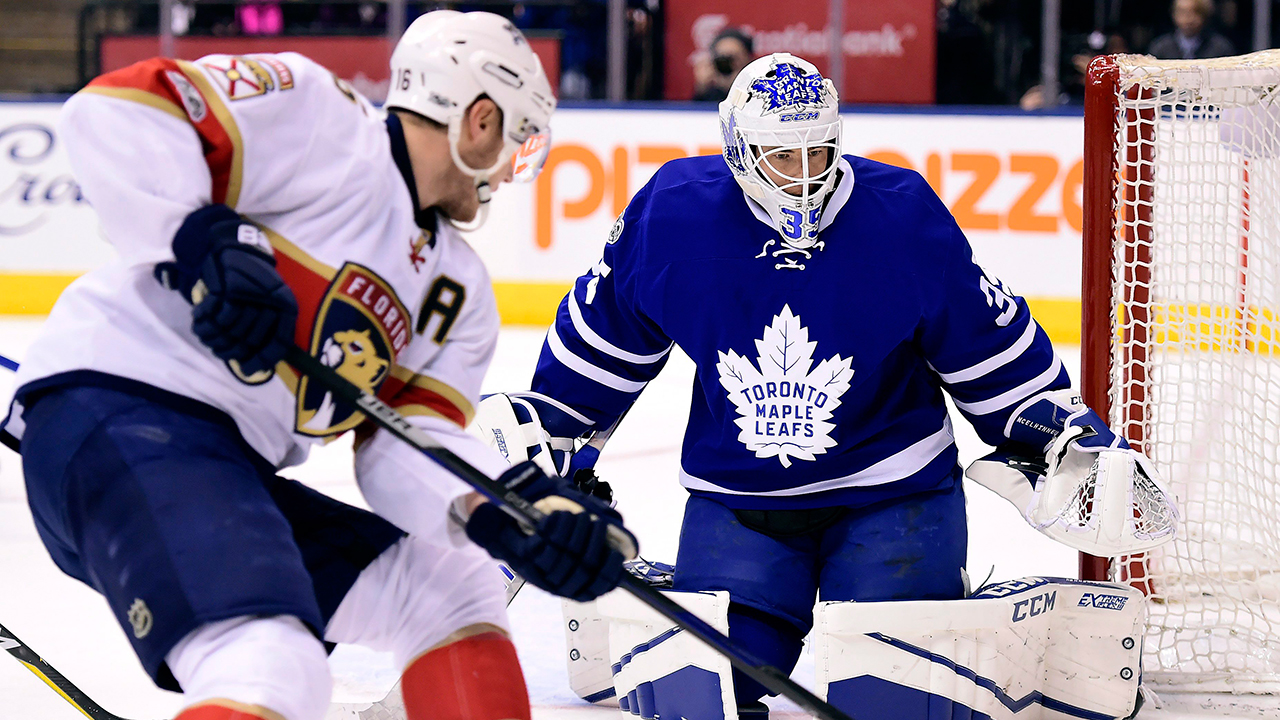
Jack Campbell has arrived in Toronto, the latest in what seems like a prolonged casting call.
Goalies are voodoo and they are the masters of randomness. Backup goalies sit squarely in the black hole of hockey knowledge.
For some masochistic reason, I will peer into the mist as best as I know how in an attempt to better understand how Kyle Dubas and the Leafs ended up with Jack Campbell. There are others who understand more because they are either much smarter than me (a cast of thousands), are privy to private tracking data such as SportsLoqiq or Clear Sight Analytics, or have mastered the mysterious art of Goalieness.
As for the trade itself, Anthony Petrielli’s article here provides a good background analysis.
I think this article by Cat Silverman below is worth a read, too, as it describes how a younger Jack Campbell rebuilt his game with the help of Dusty Imoo, a man who understands Goalieness. It will help set the stage for what comes later when I show Campbell’s career results.
I took a look at how Dusty Imoo has helped Jack Campbell rediscover his game with the AHL Reign for @InGoalMedia: https://t.co/bS3i6gKFRI pic.twitter.com/UD15avlidp
— Catherine Silverman (@catmsilverman) December 13, 2016
1. McBackup and Friends
When the original McBackup, Curtis McElhinney, and Calvin Pickard were placed on waivers on October 2, 2018, Carolina and Philadelphia snapped them up immediately. That was the last time the Leafs really saw solid backup goaltending, much to the consternation of Leafs fans. They couldn’t understand why a homegrown, younger Calder Cup-winning AHL goalie (Sparks) would be favoured over the beloved clutch veteran, Curtis McElhinney.
Fans have stood by and watched as Toronto has developed, discovered, pondered, and tested a long list of options since 2017. McElhinney, Garrett Sparks, Calvin Pickard, Michael Hutchinson, Michael Neuvirth, and Kasimir Kaskisuo all precede Jack Campbell.
Although there are “goalie statistics” floating around that cover wins/losses and goals-against average, they are not truly goalie statistics. A goalie on a better team with better defence will get a big advantage over a goalie on a weak team. These are basically team statistics that include the goalie. Save percentage is much better, but it is still fatally flawed by the fact that all shots are considered equal. All shots are not equal — ask any goaltender or shooter.
Save Percentage Above Expected
I will be focusing on save percentage above expected or “SVAE” as a basic measurement of goalie effectiveness. The “expected” comes from xG models that predict the likelihood of a shot going in based on analysis of over a million shots and their characteristics, including shot location, rebounds, angle, time and distance between shots, shots on the rush, etc.
It’s not perfect; it’s just the best information that we have publicly to weigh shot danger.
Almost any weighting is frankly better than treating a blue line shot the same as one from the inner slot. Expected goal models do much better than that — I will be using data from two of the best sites, MoneyPuck and Cole Anderson.
First, let’s look at how the backups have performed using the MoneyPuck xG model estimate of “Save % Over Expected”. (I don’t use the more common .939 format for save percentages used in hockey; I prefer the 93.9% format.)

The two goaltenders closest to winning a job have been Garret Sparks and Michael Hutchinson who have each played a total of 20 games over the past two seasons. However, their results have been mediocre.
It’s also interesting that three of the Marlies‘ goalies that auditioned (Sparks, Kaskisuo and Pickard) presently sit at the bottom of MoneyPuck’s 2019-20 goalie rankings, with the lowest save percentage above expected (although they have only combined for five games played).
It makes one wonder about the development of goalies, the value of an AHL championship, and the adjustment needed to deal with NHL shooters.
Sparks and Hutch
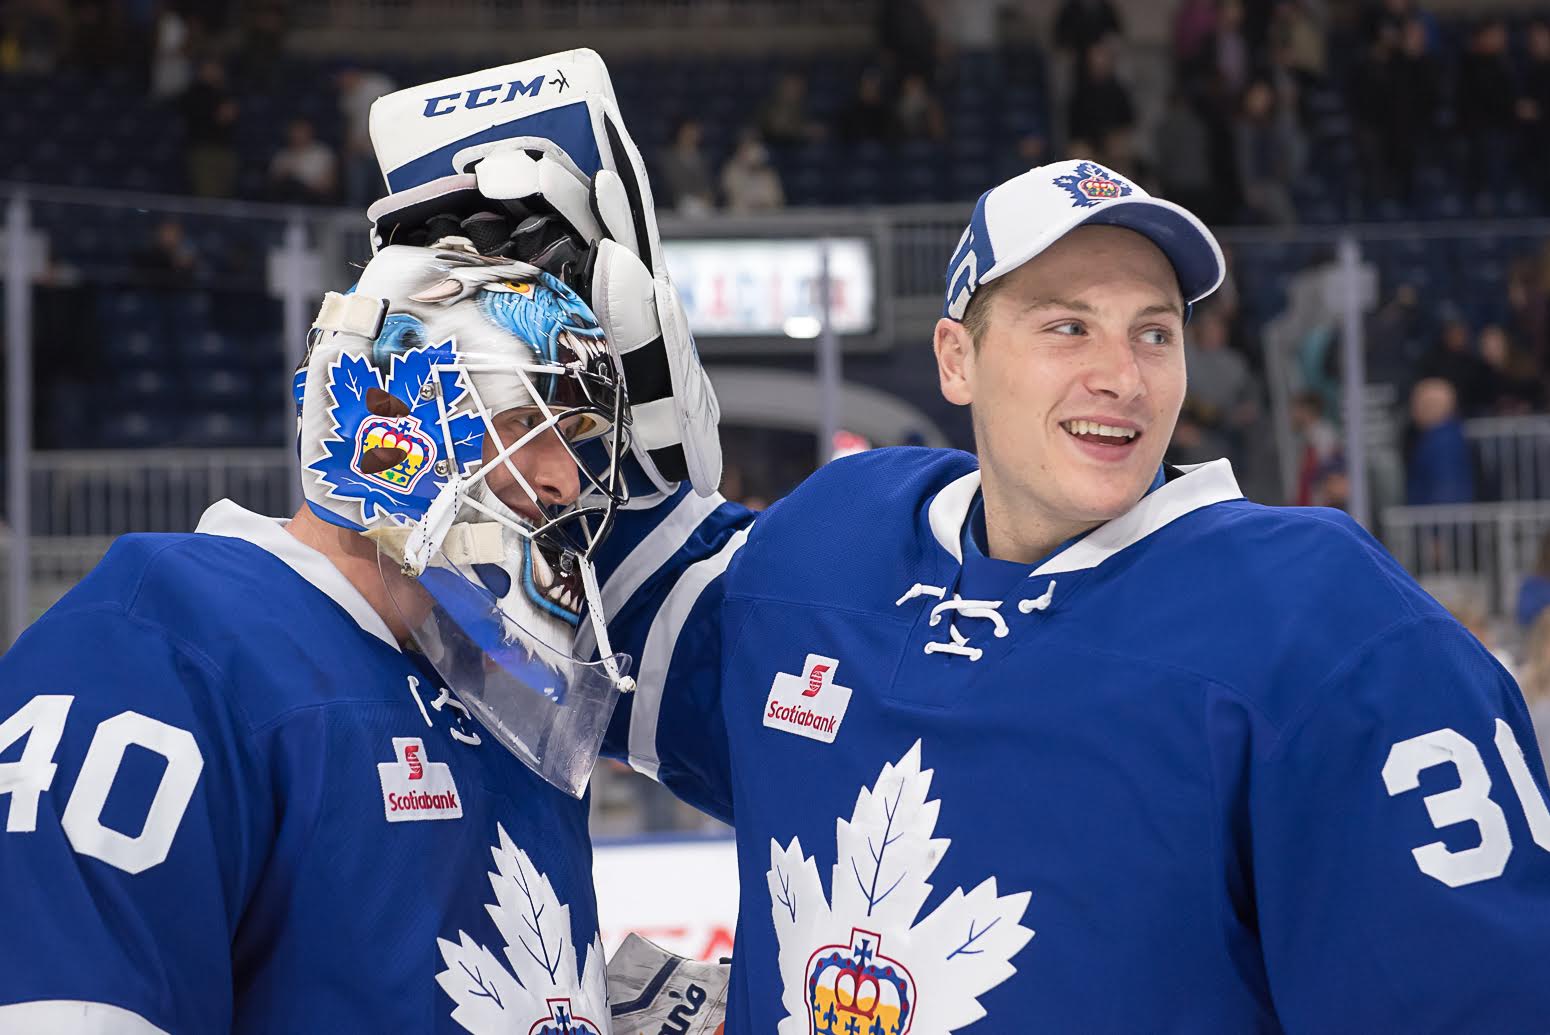
Last season, Garret Sparks ranked 29th out of 29 goalies who played 20-40 games (a range I chose to mostly cover backups). Familiar names like Jack Campbell, Curtis McElhinney, Casey DeSmith, and Alexandar Georgiev ranked third, fourth, sixth, and seventh, respectively.

This season, Michael Hutchinson ranks 23rd out of 31 goalies who have played 10-25 games. Notables include Georgiev in the eighth spot, McElhinney in 14th, and Jack Campbell in 25th.
Wait, why did the Leafs trade down to get Jack Campbell? Let’s try to answer that.

The results have been underwhelming on the backup front, to say the least.
But analysts will remind us that we can’t hope to reliably assess a goaltender without thousands of shots and ideally multiple seasons. That begs the question: How can a team wait that long if a goalie is underperforming? They can’t. All they can do is make a risky decision based on a history of performance, statistical analysis, advice of goalie experts, and the temperature of the team and the coach.
2. Jack Campbell and Friends
We know that looking at one season doesn’t tell us too much about goalie performance in future seasons. If it did, everyone would have projected Frederik Andersen’s drop-off this season or Hellebuyck’s rise. Future performance could be a key factor for Leafs management, though, since they have had an ongoing backup issue.
After giving Hutchinson 15 games to confirm his borderline value and after Andersen fell to injury, the Leafs finally went out and picked up a backup goalie.
The part about Campbell that is also attractive is that he is locked up for two more years beyond this, so we will have a set goaltending tandem and be able to roll with it.
– Kyle Dubas
Although Jack Campbell is here right now to help the Leafs in the wake of Andersen’s injury, his contractual term is important. That also means any evaluation they conducted would have included a longer-term view — not just one focused on this season.
2019-20 Results
There is no question that Jack Campbell has a lot of talent and athleticism. Otherwise, he would not have put up last season’s numbers.
Sunday mornings are the perfect time to enjoy butterstacks 🥞 and Jack Campbell delivered a beauty against Jonathan Toews last night pic.twitter.com/bRgRHKWtOP
— InGoal Magazine (@InGoalMedia) November 3, 2019
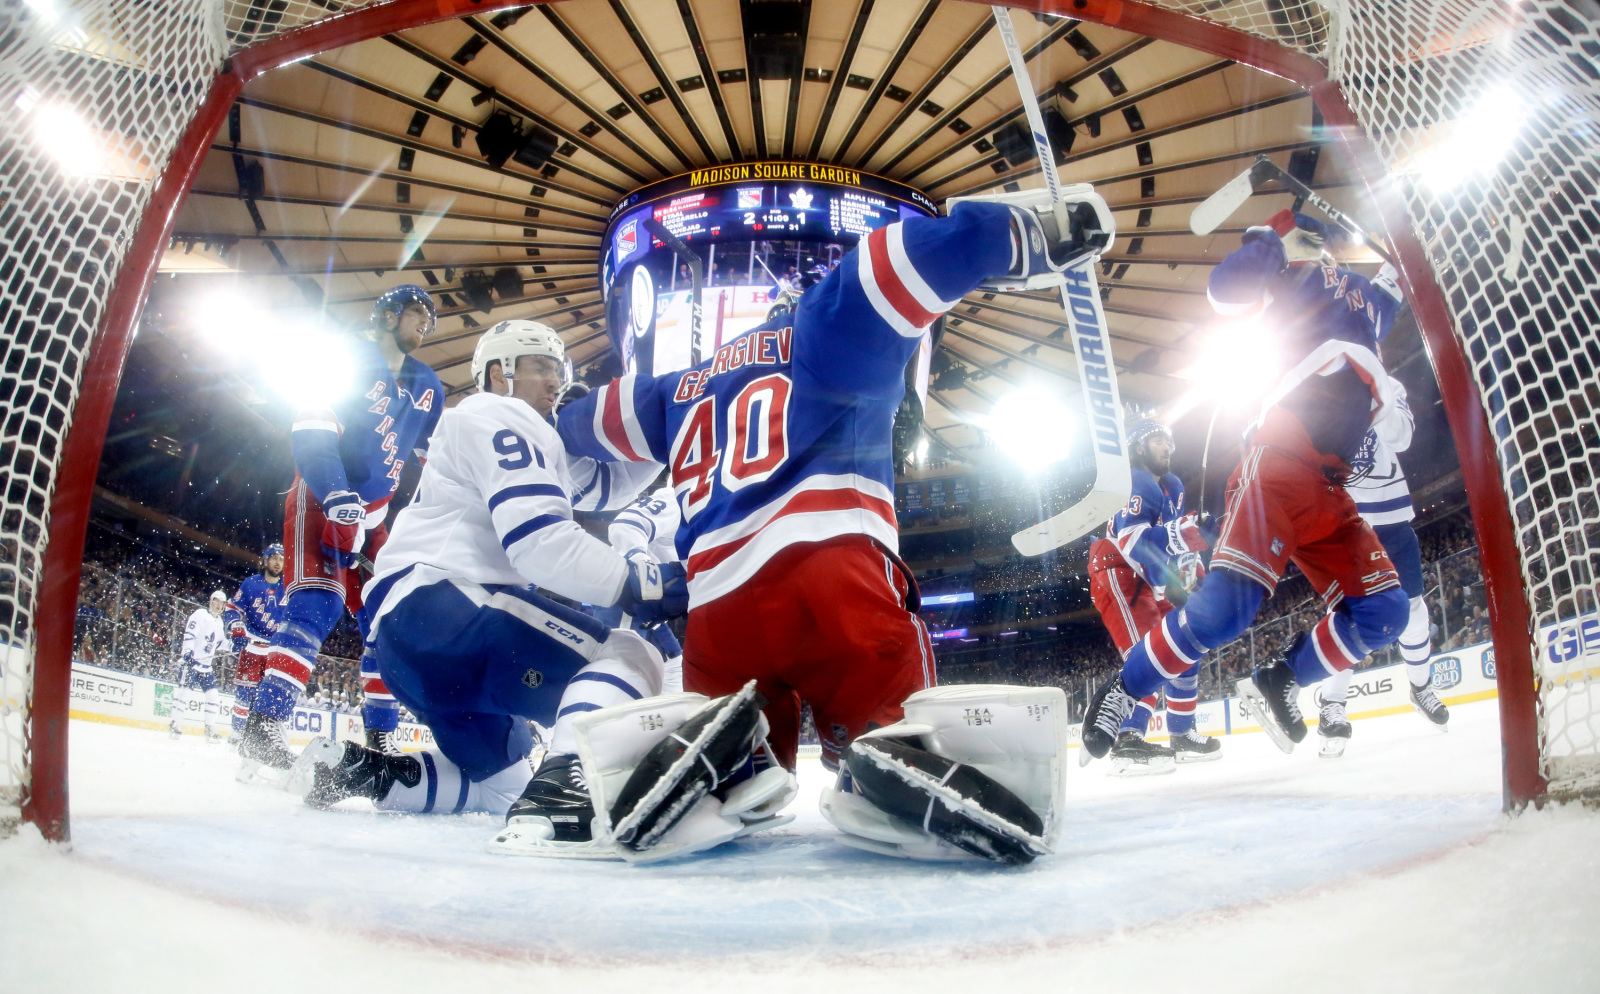
Still, he has not had a great 2019-20 season, and while the Leafs managed to end up winning his first game in overtime, objectively Campbell fell short of having a good debut with an 86.7% save percentage.
His save percentage of 89.9% now ranks 50th for goalies who have played at least 10 games. However, Michael Hutchinson hasn’t had a good season, either, ranking 60th of 62 goalies at 88.6%. Another trade option, Alexandar Georgiev, sits in 34th place with a 90.8% percentage.
That is the open question: Why did Kyle Dubas sign a goaltender who has similar numbers to Hutchinson this season and who is ranked far below Georgiev?
Contract Considerations and Trade Cost
Cap hit and contract status were clearly considerations for the cap-constrained Leafs. Jack Campbell’s $1.65M contract for the next two years was signed just before this season started. He was 28, a pending UFA, and had just come off a banner year. The Kings rewarded him with a hefty extension.
Some of his closest comparables on Cap Friendly are contracts like Keith Kincaid (2019), Chad Johnson (2018), and Thomas Greiss (2015). But Cam Talbot and Alex Stalock in 2014 were the last contracts I could find where a cap hit percentage was over 2% with so few NHL games played (38). The Kings took a risk and the Leafs inherited that risk.
Campbell’s $675K cap hit this season is $25K less than Hutchinson, which makes him an easy fit under the Leafs tight salary cap (even if Rielly and Ceci return before the end of the season). However, his contract over the next two years will be twice what the lower end of the backup market makes, and that will eat into whatever discretionary cap dollars the Leafs have for other parts of their roster.
Overall, I think the size of the extension was a deterrent to Dubas & co., but they ultimately chose to increase funding for the backup position given what they saw in Jack Campbell.
Other names have cropped up, such as Ryan Miller. He was an option, but I think we need to factor in the facts that he will be 40 in July, is a pending UFA, would be on a more restrictive 35+ contract, has a modified NTC, apparently prefers staying in California, and last but not least, he has career averages below Campbell.
Trade Value
The hype and results around a younger pending-RFA goalie like Alexandar Georgiev surely increased his trade value compared to a more costly, underperforming option like Campbell. My rough sense of the Clifford/Campbell trade split is that Clifford cost the Leafs Trevor Moore and a third-round conditional pick (which could easily become a second), while Jack Campbell cost a third rounder.
New York is patiently looking for a return on Alexandar Georgiev, and I think we will see that higher cost negotiated before the trade deadline. I don’t believe Toronto had the appetite to pay more — whatever it was the Rangers were demanding from the roster or from higher picks.
This, I believe, was the key factor in moving away from Georgiev, combined with the urgency spiked by Andersen’s neck injury. An acceptable Georgiev deal might have come through eventually, but if it happened closer to the February 24th trade deadline, that might be academic for the Leafs and their playoff prospects for this season.
While 2019-20 results are important, I believe that any GM making the decision to bring in a backup goaltender on term would try to look at more reliable numbers than a 20 game sample on a weak team like LA. After all, the difference between Jack Campbell’s 50th place and Georgiev’s 34th place is six extra goals allowed this season.
Let’s do some analysis on how Jack Campbell might perform over the next two-and-a-half years.
3. Career Performance Comparisons
Adjusting for Rebounds
The more shots we have to analyze, the more reliable of a picture we have around a goalie’s talent (there is a trade-off — seasons further back in time probably should be weighed less using a Marcel approach, but that’s a refinement beyond the time and scope of this article). The table below is sourced from Cole Anderson’s season-level data combined with a shot-weighted mean calculation that we discussed. Besides the comparison to expected save percentage, Cole’s work also adjusts for rebounds.
Here is an explanation taken from one of the blogs on his website as to why adjusting for rebounds is an important refinement:
“…rebound shots results in higher observed probability of a goal, which makes sense, and expected goal models generally reflect this. However, this disproportionate amount of an expected goal can be confounding when ‘crediting’ goalie for a rebound opportunity against when it could have been prevented. Looking at my own expected goal model, rebounds account for about 3.2% of all shots, but 13% of total expected goals. This ratio of rebounds being about 4 times as dangerous is supported by observed data as well. Shooting percentage on rebounds is about 27%, while it is 5.8% on original shots.”
– Cole Anderson
We can see from the table below that Jack Campbell tops the list I had put together for reference. That’s mainly because he had a very good season last year that outweighed his weaker results this year. Georgiev remains near the top. Casey DeSmith was someone I mentioned a couple of weeks back as a possibility from the Penguins organization, but he has really been struggling down in the AHL this season and that would have affected interest.
Curtis McElhinney, Michael Hutchinson, and Garret Sparks all have negative career results (I’m certain that the move to put McElhinney on waivers after two successful seasons was influenced by his career numbers).

These career averages for save percentage above expected, adjusted for rebounds, help us understand why Jack Campbell was a viable backup candidate, even considering Georgiev.
Season-by-Season Performance
The chart below maps their performance over time. I’ve added in Frederik Anderson as a reference (you can see how much he dropped from his best season last year).
The scale here needs explaining. Besides looking at save percentage above expected and adjustments for rebounds, the goalie data has been adjusted to take into account the information we have from a goalie’s shot data prior to a season. In this case, the prior 2,000 shots are used to create a more reliable estimate over a shorter single-season timeframe (that’s what Bayesian inference and regression to the mean are in a nutshell).

I think we can see why the decision was ultimately made to move away from Michael Hutchinson. It wasn’t just this season, but knowing that he now had significant below-average results in four of his past five years.
Jack Campbell’s career has been steadier with the exception of this season, where his play has dropped off. The truth of his future performance likely lies between his outstanding results last season and a poor first half this season. Much of it may depend on how well goalie coaches help him to continue to adjust his game.
Simulations
I ran a simulation using a tool at Cole Anderson’s site to better reflect how variable each season’s results can be and to produce a distribution for a goalie’s total career shot performance versus expected (the result on the right). As Cole explains:
“Each simulation represents goaltenders actual, normalized goals-against relative to the simulated ‘average’ goaltender. Each expected goal value is ‘flipped’ to represent a goal or save, like a coin.”
Here is Jack Campbell’s simulation:

You can see that the bulk of the simulations for his career favour a save percentage lift above zero. Better simulation results are at the top. His “simulation dots” are centered closer to the +.5% lift area, which would be close to the 75th percentile for NHL goaltenders. Very few fall below the 33rd percentile.
You can also clearly see how exceptional last season was. The dots are almost entirely near the top of the chart, showing that his results were clearly well above average and very few times could be tied to “luck.” The simulation for this season shows a wide range but most end up below the zero expected lift line.
For comparison purposes, here is Michael Hutchinson:

As was mentioned, Hutchinson has had several below-average seasons since he turned 25 and the vast majority of the simulations are below expected.
More on Jack Campbell
Hopefully, we now have a clearer understanding of Jack Campbell in comparison to the other main options.
One other area where I dove deeper was this year’s performance. Every shot he has faced comes with an xG estimate — the probability it becomes a goal. This table summarizes how his results have varied by different xG ranges (I prefer this to arbitrary definitions of low/medium/high danger). To do this, I used the GameShots visualization available at the Toronto Maple Leafs Advanced Statistics page.
Campbell had no issues saving the “low percentage” and other more “low-medium” shots with less than a 5% chance of going in. In fact, he saved 2.6 goals more than expected. Campbell’s difficulty was dealing with the shots with a 5-to-15% chance of going in, where his save percentage ranged from 5.7% to 6.67% below normal.

I went to GameShots and looked at the worst category: xG shots in the 10-to-15% chance range. Red denotes goals, green saves, and yellow missed shots. What I see is a larger than expected number of wrist shot goals from the inner slot area.
On the pre-game broadcast, it was mentioned that Campbell has been allowing more goals this season below his raised glove and above the pads. These low-angle slot shots are small in number but very much impact a goalie’s results. In that way, they can be both informative and volatile.
Higher-danger shots over the long run are usually seen as more indicative of a goaltender’s talent. We don’t have all the details here; the xG in this chart assumes an average amount of untracked data like pre-pass movement, velocity, screens, etc. There is a lot of uncertainty on how Campbell will perform in that area going forward.
Hockey is a fluid and changing game as goalies adapt and shooters adapt. It will be interesting to see if Campbell can adapt to the latest trend with his new team.

Conclusions
The “Jack Campbell experience” has begun.
Based on my analysis, the Leafs have taken some cap risk and paid a reasonable price to acquire a backup who is having a subpar season but with above-average career potential.
Looking more deeply and more exactly into his performance history tells us that he has a distinct upside and most likely represents an upgrade over previous backups. Nothing about backup goaltending is certain, but the risk seems worth taking in Jack Campbell’s case.
Given the circumstances with Frederik Anderson’s neck injury and the Leafs in jeopardy of missing the playoffs, I believe this was a good and necessary trade to solidify the goaltending this year and beyond. Hopefully, it was not too late for this season and Campbell can regain his form on a new team despite the patchwork defense.
I’ll leave you with this highlight package of Jack Campbell (and Kyle Clifford) by @TheLeafsIMO.
Jack Campbell and Kyle Clifford are exactly what the Leafs need. Here's a short highlight package with some of their best plays. pic.twitter.com/VQa79n1Xbq
— Michael (@TheLeafsIMO) February 6, 2020


