


As we continue to wait for Stephane Robidas to make his on-ice debut in the blue and white, it makes sense to have a look at what we can expect from the experienced blueliner.
Maple Leafs management appears to have high hopes that he can bring stability playing alongside one of their two young defenders, Morgan Rielly or Jake Gardiner. His veteran status and leadership will likely be all the more important to management now that injuries will prevent Henrik Tallinder from making the team and may prevent Cody Franson from playing to start the season (as of this writing, we still don’t know the extent of his injury). So, let’s get started.
As a quick note, this piece was started a while ago when Extraskater was still operational. I know this makes fact checking what I’m writing difficult, but please bear with me. The data compiled in this piece comes from nhl.com, extraskater.com, stats.hockeyanalysis.com, progressivehockey.com and behindthenet.ca.
How Was He Used?
Here’s a table of Robidas’ ice-time over the past 4 years:
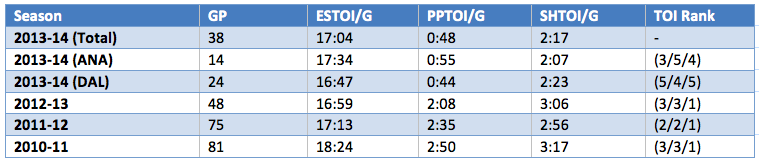
So, what does this table tell us?
Well, other than this past season when he broke his leg twice, Robidas has been pretty healthy. In fact, since the 2004-05 lockout Robidas has played 89% of all possible games (that number was 95% prior to the 2013-14 season). Perhaps concerns about his injury prone-ness are a little exaggerated.
Next, what we see is that up until the 2013-14 season Robidas had been Mr. Everything – he played on the penalty kill, the power play and at even strength. His power play usage took a big hit in 2013-14 and his time on the penalty kill dropped as well. Over the past four seasons, Robidas’ even strength ice time has been trending downwards.
Where would Robidas’ TOI have put him amongst the Leafs’ defenders in 2013-14? His 17:04 ESTOI/G would have put him 3rd behind Gardiner (18:10) and Phaneuf (17:27). His 0:48 PPTOI/G would have placed him 5th behind Phaneuf, Franson, Gardiner and Rielly (1:55) [excluding Liles]. His 2:17 SHTOI/G would have landed him 3rd [excluding Fraser], behind Gunnarsson and Phaneuf (2:49) but ahead of Gleason (2:05) and Ranger (1:54).
What else should we be looking at? Well, let’s check out who Robidas played with.
In 2013-14 while with the Ducks, Robidas was paired with Francois Beauchemin 31.9% of his shifts and with Luca Sbisa for 24.7% of his shifts. In 2013-14 while with the Stars, Robidas was paired with Brendan Dillion a whopping 92.8% of the time.
Okay, now let’s have a look at how Robidas’ coaches used him. Player usage charts are great at conveying this information so we’re going to look at a couple but fear not, I’ll also do my best to describe what we’re looking at here.
First up, Robidas with the Ducks:
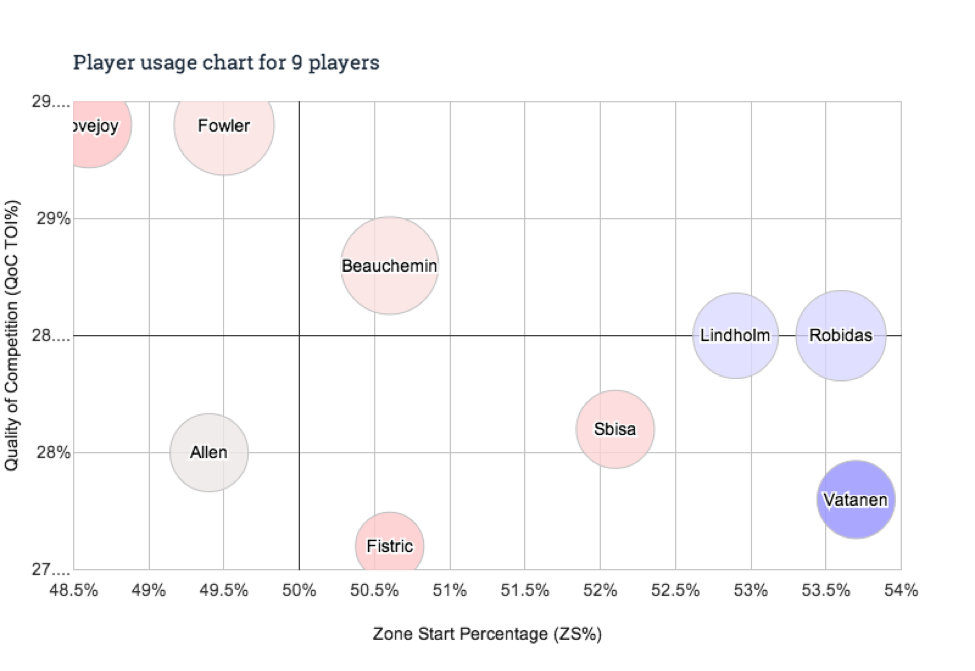
The interpretation: Robidas’ QoC was about average (the horizontal and vertical lines indicate the averages), he got favourable zone starts (over 50% of non-neutral zone shifts in the offensive zone), and was a slightly positive possession player (over 50% CF%). The size of the circle is ice time, but since we already covered that I’ll leave it be from here on out.
Then with the Stars:
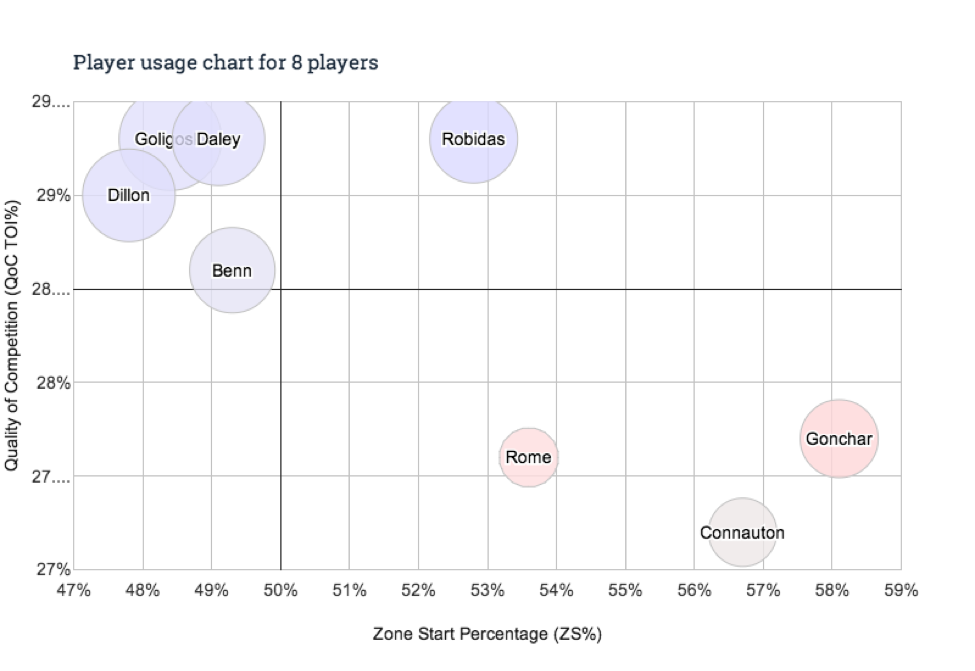
The interpretation: Robidas’ QoC was well above average, he faced favourable one starts, and he was a slightly positive possession player.
It may be worth asking whether or not the QoC change in 2013-14 between Dallas and Anaheim was due to easing Robidas back from injury. It’s also worth asking whether or not the change in 2013-14 zone start numbers from previous seasons was made because Robidas can no longer play the same kind of hockey he used to at his advanced age. Or perhaps it was something else entirely.
Now, both of these teams made the playoffs and so the favourable zone starts could simply be a by-product of playing on a good team. So, let’s have a look at what his ZS% Rel from extraskater looks like. This works the same way that CF% Rel does: it’s just the percentage point difference between what happens with Robidas on the ice and without him on the ice.
With the Ducks, he started in the offensive zone 1.2 percentage points (i.e. 51.2% v.s. 50%) more than the team did when he wasn’t on the ice; favourable, but not really what I’d call “sheltered.” And with the Stars, it was 2 percentage points. Same thing: Still looks like favourable starts, but not what I’d call sheltered.
Going back further than this past year though, we see that Robidas drew some much tougher minutes, getting a ZS% higher than 45% only once in the previous 3 seasons and never higher than 50%. His ZS% Rel was negative all three seasons and lower than -5% twice. So, going a little further back, Robidas has played those tough minutes historically.
How did he do?
A quick note about Rel CF% (Relative Corsi For %): Progressive Hockey calculates this slightly differently than what we’ve been using in the past. This is the percentage point difference between the on-ice CF% of the player and “the average performance of his actual on ice teammates and competition without the player in question, weighted by their ice time with him” (material in quotes directly from Progressive Hockey).
Having a quick look at Robidas’ Rel CF% from progressivehockey.com shows that in his 14 games with the Ducks in 2013-14 he had a small but positive (0.85%) number and ranked 3rd among Ducks defenders appearing in more than 10 games. Looking at how he fared in 24 games with the Stars during the 2013-14 season, we can see a very similar result: a small but positive number (0.70%) that ranked him 1st amongst Stars defenders having played more than 10 games. Looking at the 2012-13 season we can see another small, positive number (0.63%), and his ranking is 5th among Stars defenders. Let’s go back one more year and check out his 2011-12 season: Robidas finished with a solid 2.32% and a 2nd place ranking among Stars defenders.
Flipping over to stats.hockeyanalysis.com, we can have a look at Robidas’ WOWY (without you, with you) to see what happened when Robidas and his partner’s were split up. Now, one of the problems with this type of analysis is that there could be a strong possibility that the context of a player’s usage changes when split up from his partner. But — interestingly — since Robidas left Dillon part way through the year, Dillon should have extensive time with other players that may not be in entirely different contexts. And considering Robidas’ zone start data is pretty similar between the two teams, that certainly helps.
So here’s the WOWY: 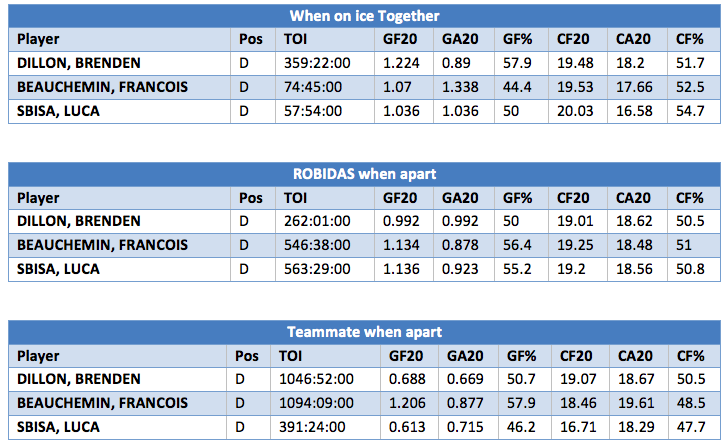
What is this telling us? We can see that the CF% for each pairing is higher than any individual value for each player. So, it looks like these pairings are good fits or something else is happening when these players are together that makes them more effective. The next thing to note is that when Robidas and Dillon are apart their CF% is identical and their GF% is also pretty close. It looks like both defencemen are sharing the load when they play together instead of one guy carrying the other. When it comes to Sbisa and Robidas playing together, it would appear that Robidas makes Sbisa better and not the other way around. The same goes for Robidas paired with Beachemin.
Next, let’s have a look at Robidas’ production statistics.
The following table shows Robidas’ production in 5v5/60 among defenders on his teams for the past four seasons.
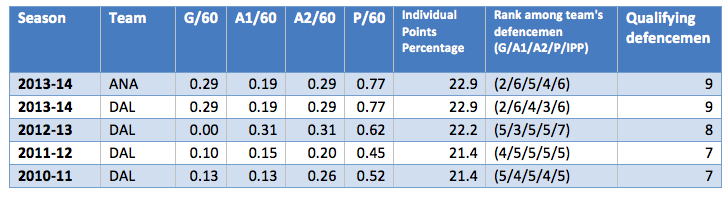
A note on the above table: stats.hockeyanalysis.com doesn’t have Robdias’ data split into each team he played for last season. As a result, what I have done is placed Robidas’ season-long numbers against both teams he played for this season.
What are we seeing in this table? Well, during 5v5 play Robidas had a very strong offensive season in 2013-14 when compared to his previous years. His G/60 in 2013-14 was more than twice as high as his next best season and if we take a look, his shooting percentage was 6.5%, a high number for defencemen (44th in the NHL among defenders logging more than 100 minutes in 2013-14). So, it’s probably not realistic to expect that same rate in 2014-15.
His other numbers seemed right in his ballpark. His Individual Points percentage (simply the percentage of goals scored by Robidas’ team while Robidas is on the ice that he receives a point from) was within 2 percentage points of his lowest number over this four season span and his assist rates are also very similar to what he’s posted in previous years.
Where would those numbers from 2013-14 place him on the Leafs (7 Leafs defenders with 100 minutes)? Robidas would have finished 3rd in G/60 behind Ranger and Gardiner; 5th in A1/60 behind Ranger, Franson, Gunnarsson and Phaneuf; 3rd in A2/60 behind Rielly and Gunnarsson; 3rd in P/60 behind Ranger and Rielly; and 8th (last) in IPP.
Where does he fit here?
Okay, so now that I’ve inundated you with a bunch of graphs, tables and numbers, what can we say about where the numbers say Robidas should fit in as a Leaf?
Well, his ice time indicates that he’d be fitting in as a top four option at even strength and on the penalty kill. His production statistics show that at 5v5 he can produce offense at about a top four clip. His possession numbers indicate that he’s a positive possession player (his numbers from last season would have been 4th on the Leafs). His zone starts show that he most recently received favourable faceoff situations, but historically this hasn’t been the case. His QoC data indicates that he faced tough opponents — not Phaneuf/Gunnar level, but not soft like Rielly or Fraser either.
I left out an analysis of Robidas’ powerplay production for two reasons: 1) This article was getting really long, and 2) It doesn’t really seem like Robidas will play on the powerplay over Rielly, Gardiner, Franson and Phaneuf.
When ExtraSkater was online I threw together a player usage chart of the Leafs defenders from 2013-14 plus Robidas, I thought this would more clearly illustrate where Robidas would fit if he was used exactly the same as last season.
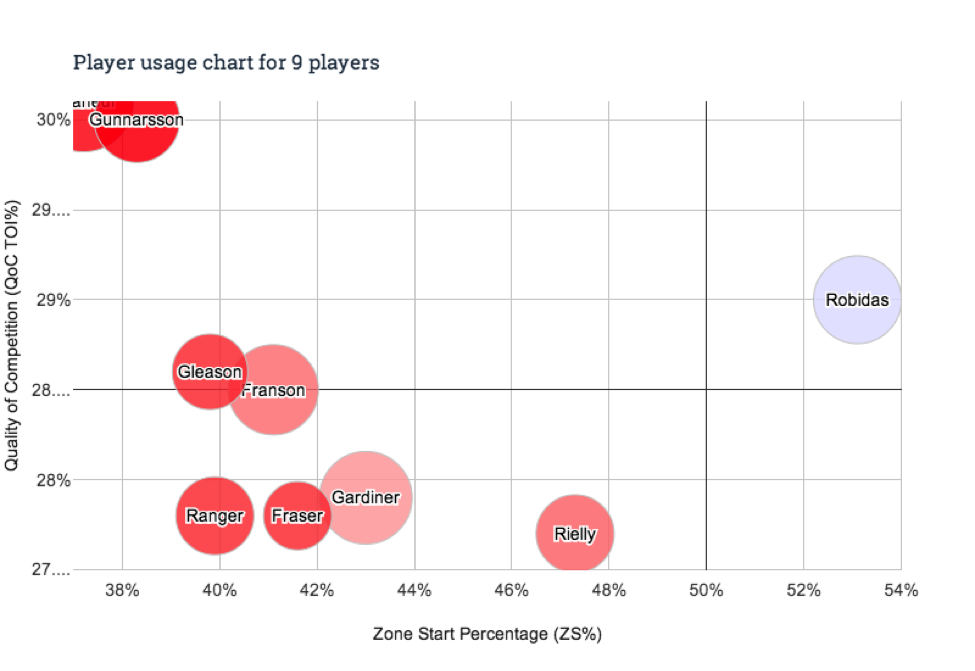
All things considered, it looks like Robidas will definitely fill a spot in the Leafs top four. Hopefully he can continue his positive possession play while trudging through what will most likely be the 45%-ish zone starts he has been tasked with in the past.


