


Index (click the link to jump to section):
-
- SKATR – an NHL player evaluation tool.
- Maple Leafs Report – a summary of each Toronto Maple Leaf skater’s key numbers, both individual and on-ice at 5v5.
- Rolling Trends – examine the current trends at 5v5 for the Toronto Maple Leafs and other NHL teams on over 25 different statistics.
- Teams Heat Map – explore the factors behind each teams place in the standing. Plus a Power Map looking at power play and ES offense./li>
- GameShots – explore shots on a rink map and see how effective teams, shooters, or goalies were based on the stats provided.
- NHL Goalie Performance – See how goalies rank on a host of advanced performance metrics.
- Shot Charts – explore NHL teams and see how their players perform on expected goal and shot rates for and against.
- General Hockey Statistic Glossary – a summary of common hockey statistics and terminology.
1. SKATR
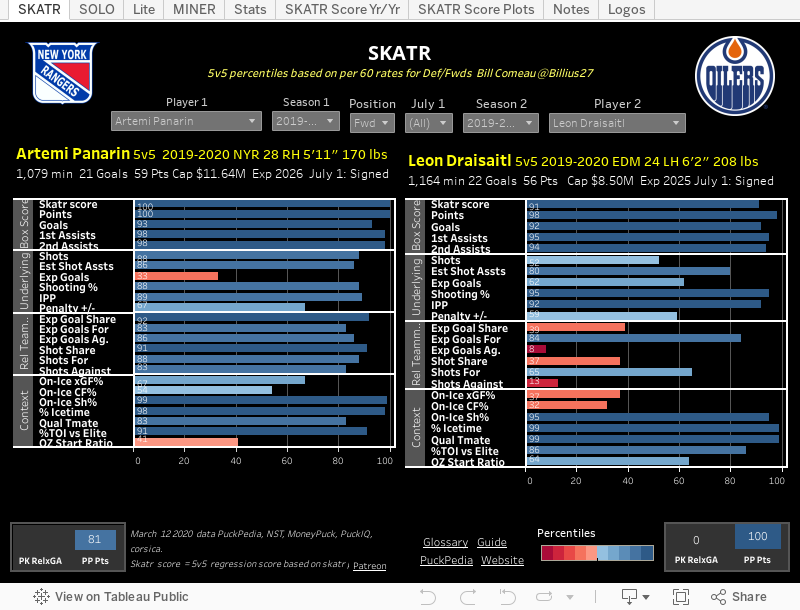
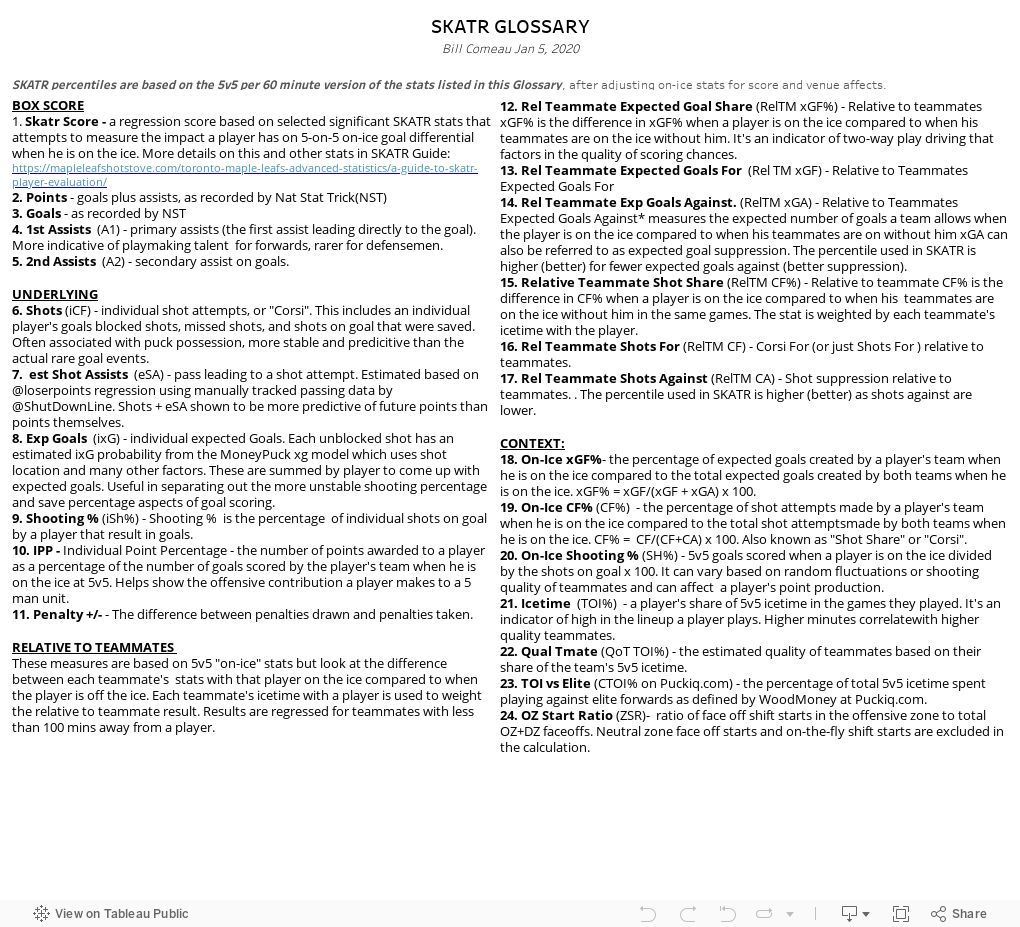
SKATR is a tool that lets you compare and assess player percentiles at 5v5 across 23 different measures, covering box score, underlying metrics, relative to teammate on-ice statistics, and context indicators. Data sources include Natural Stat Trick, MoneyPuck, the actual NHL play-by-play data feed, PuckPedia, and PuckIQ.
The idea behind SKATR is to make the exploration of hockey players more understandable and intuitive through a visual overview. There is a brief SKATR glossary immediately below the viz. A complete guide can be found here.
To allow fair comparisons, each player’s 5v5 statistics are adjusted for score and home/road game effects before converting to per 60 minute rates. Then percentiles are calculated for each statistic by comparing them against fellow players in the same position and for the same season.
Only players with 100+ minutes of 5v5 ice time qualify. Red to blue bars show the player ranking from 0 to 100, with the actual percentile rank shown as a label on the chart. The lowest percentiles are “worst” – they have dark red short bars. Long dark blue bars have the highest percentiles and are the “best”.
To use SKATR, start at the menu options below the main title, then select position (Defenseman or Forward) and contract expiry year (leave at “All” to start). Then select season under Season 1 and finally a player under Player 1. Only players matching your criteria will be listed when in the Player 1 drop-down menu. Start typing the last name of the player in the selection box to speed up your search.
If you find that the player isn’t available or the bar chart is blank, check to see that the position, expiry year, and season (100+ minutes) all make sense for that player.You can then compare to a second player if you like (Player 2 and Season 2) using the right side menus. You can choose to compare different seasons for one player this way as well.
Once you have the main SKATR dashboard working, check out the tabs at the top and explore the “Solo”, “Miner” and “Stats” tabs as well as the notes and tips. There are also some useful links at the bottom.
2. Maple Leafs Report
This viz lets you rank the Leafs on a hockey statistic by position (all, forwards, or defensemen) and then pick a player to spotlight — to be shown on the right side. Note that most statistics are individual and cover all game strengths, but four are 5v5, adjusted for score and venue, and report how the five-man unit does when a selected player is on the ice.
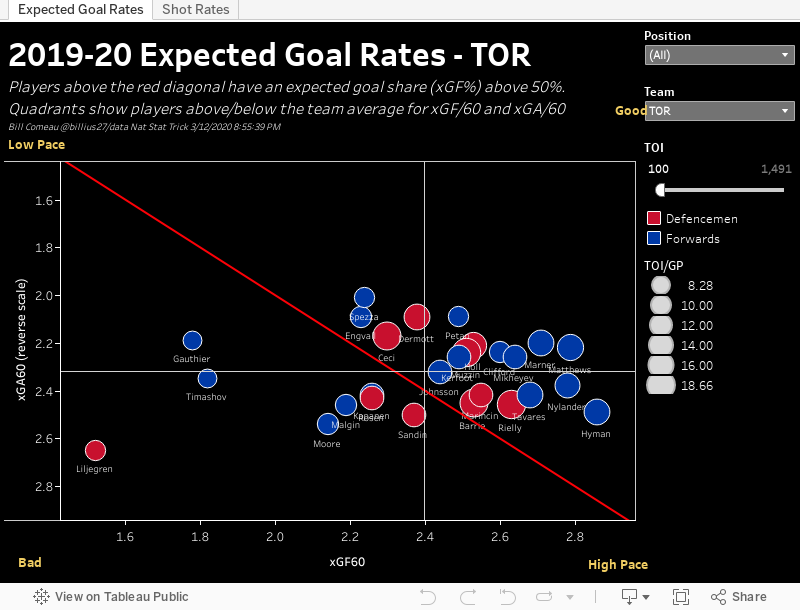
The additional tabs at the top of the viz contain ‘quadrant’ charts for 5v5 on-ice statistics. These let you see a plot of the Leafs players by expected goals, scoring chances, and shot rates for and against.
Players in the upper right have per-60 rates better than the team average. Players in the bottom left have per-60 rates worse than the team average. Note that the vertical axis is reversed, so that lower rates against are at the top.
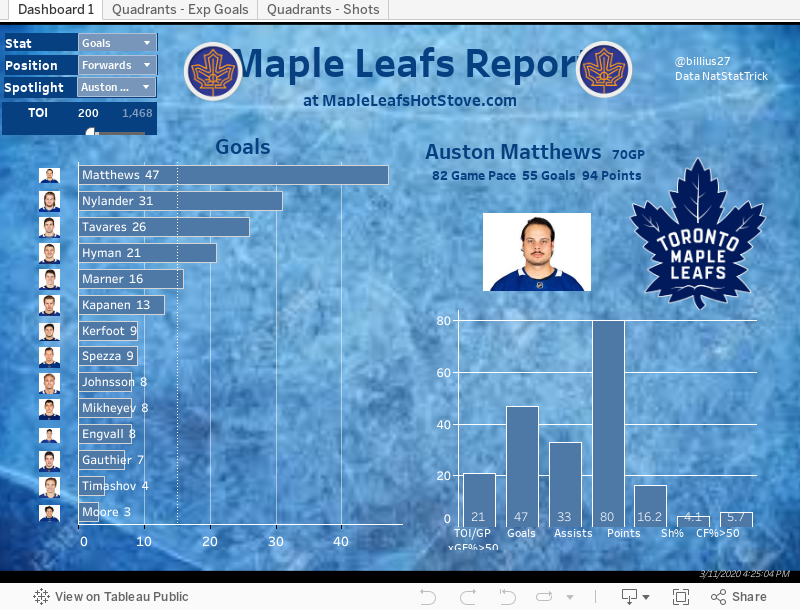
Maple Leafs Report usually updates the day after Leaf games.
3. Rolling Trends
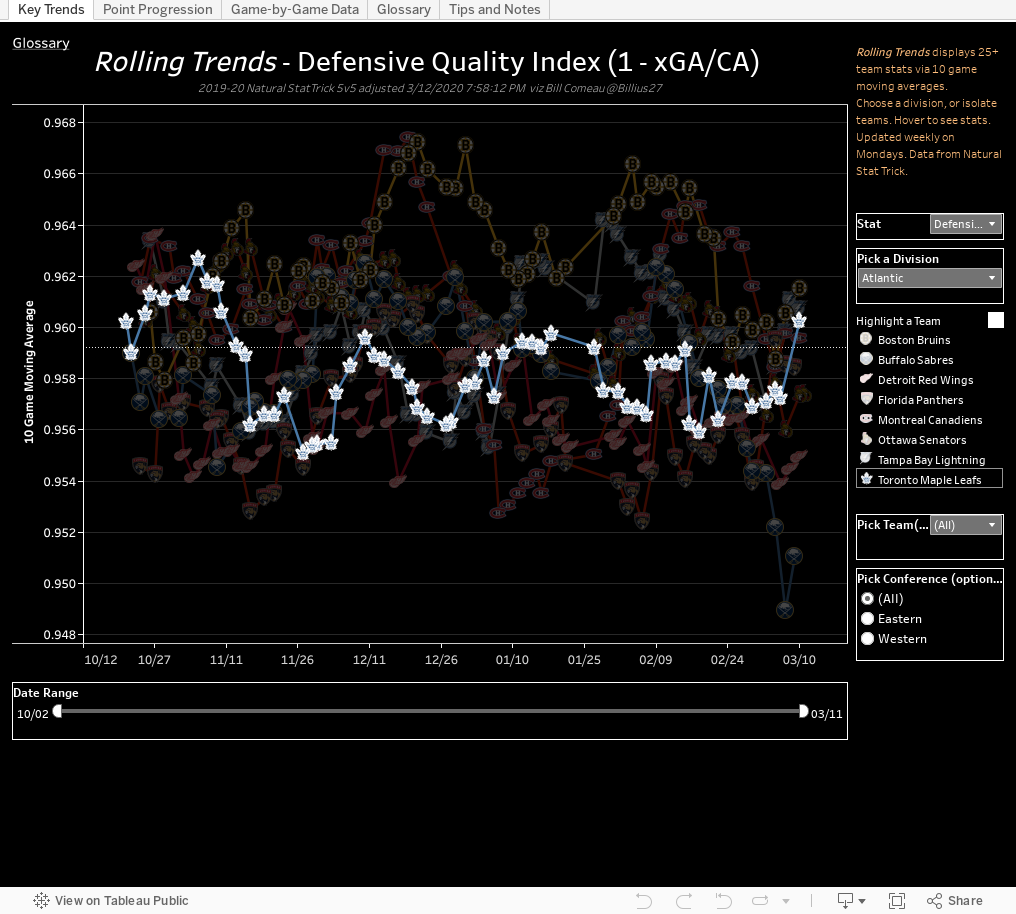
Rolling Trends lets you select from a wide variety of 5v5 team statistics to see how the Leafs are trending (it lets you check on other teams as well). To smooth out some of the noise in game-to-game data, a 10-game moving average is used. This averages the last 10 games — that’s the trend you see plotted.
You can pick a statistic, a division, and then click a team to highlight.
There is a date range slider to let you zoom in on a certain range of game dates. Clicking or hovering on a trend point will also pop up the statistic as of that game. If you would rather select a set of teams and focus on them, set the division to “All” then use the “Pick Teams” menu at the bottom to check as many teams as you like. The chart will then include them.
If you would rather look at individual games without a moving average, use the second tab at the top of the viz.
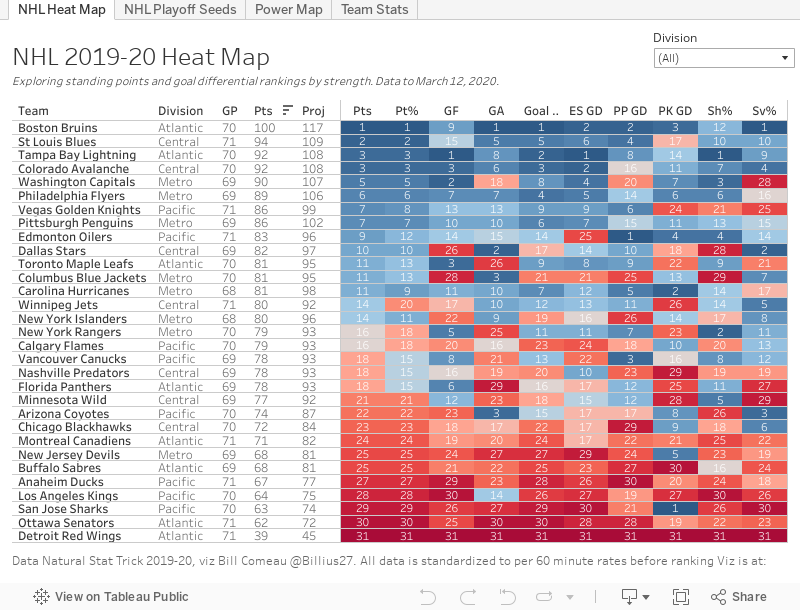
4. Teams Heat Map
This data viz let’s you look at team standings, including their projected points. Rankings are shown for each component (blue = best). Key components include points, points percentage (points divided by available points), goal differentials by strength as well as shooting and save percentage. Teams are ranked after conversion to per 60 rates. Rankings are colour-coded (dark blue = best).
In addition, there is a stats summary and a ‘Power Map’, highlighting how teams perform on the power play compared to their even-strength production.
5. GameShots
GameShots is updated each Monday and lets you explore the location and danger of shots. You can look at a team, a shooter, a goalie, or a defending team. You can look at any team, player, or goalie. The instructions are on the left and the viewing options are at the top. Viewing options include heat maps, shot maps and maps showing the different shot types. Note that you may have to reset your menu choices one at a time so that they all make sense if you decide to change teams or shooters.
All data comes from MoneyPuck. Note that I chose to eliminate empty net goals and shots from outside the blue line. I consider them as noise that has little to do with the art of shooting.
MoneyPuck explains their expected goal model here: http://moneypuck.com/about.htm.
xG models are at the forefront of modern hockey analytics, they allow us to examine teams, players, and goalies more closely, considering the danger associated with each shot. The MoneyPuck model is state of the art and uses a machine learning approach called ‘Gradient Boosting’. This allows it to “learn” based on the patterns of over one million unblocked shots.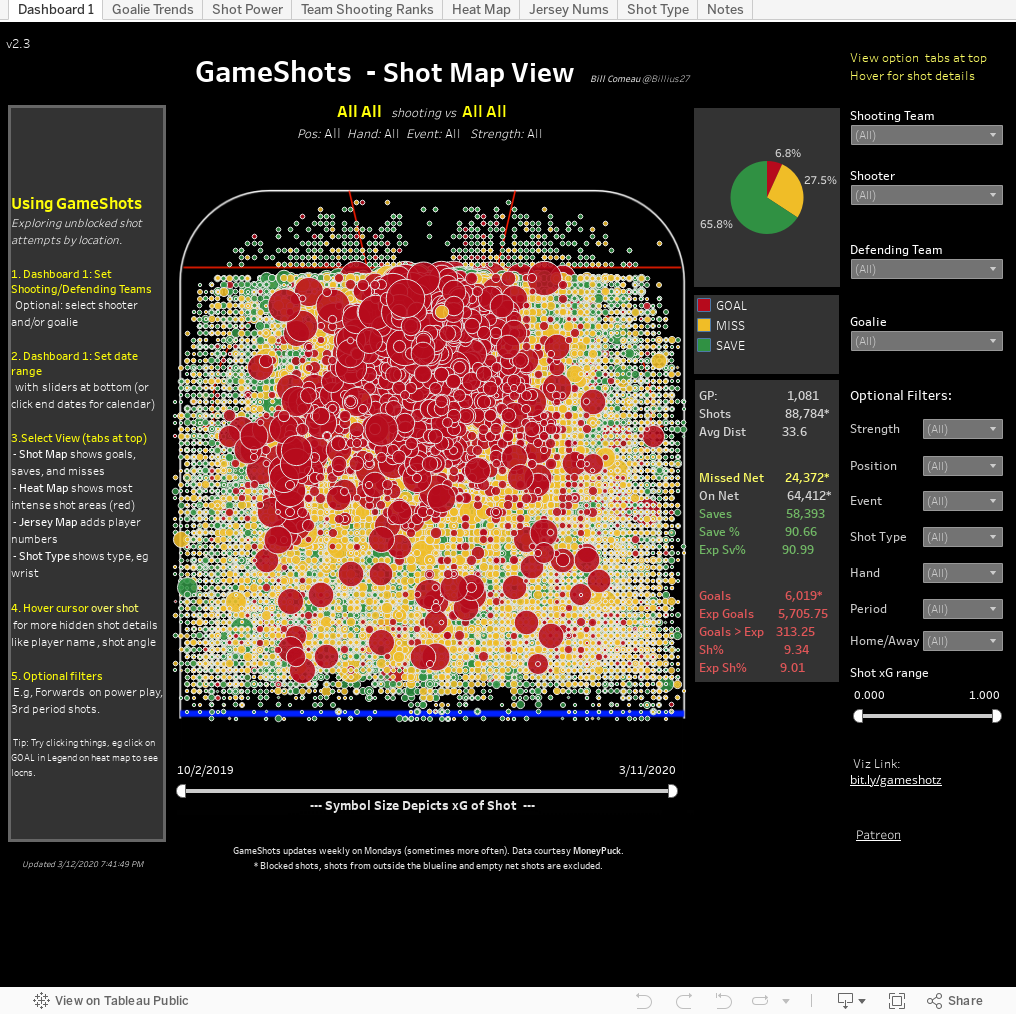
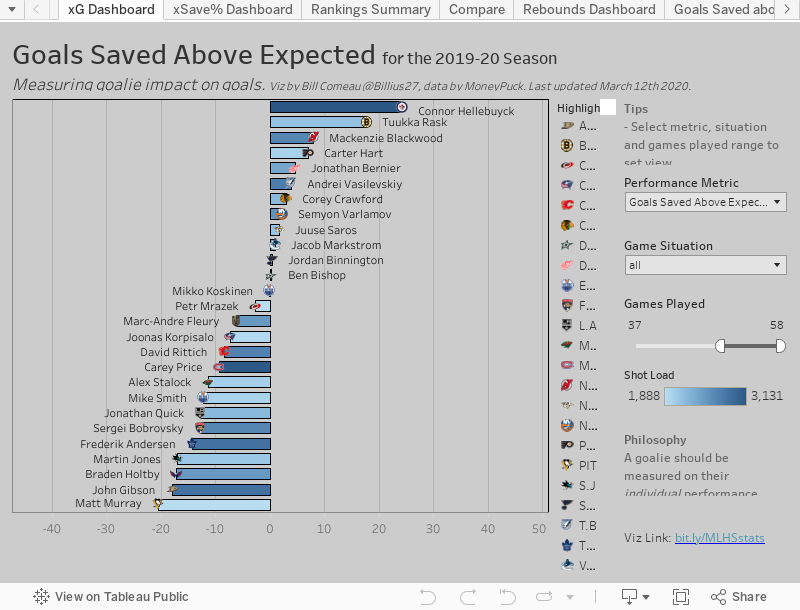
6. NHL Goalie Performance
This viz is powered by the MoneyPuck model for expected goals.
NHL goalies have been traditionally measured by goals against average, wins, and save percentage. Each of these has flaws when trying to isolate the goalie’s performance. This viz takes those statistics a step further and looks at the performance of goalies above what is expected based on the shot danger they face. There are two key statistics: GSAE, or “Goals Saved Above Expected” and “Save % Above Expected”.
Goalies are ranked in the first three tabs. The third tab is a summary heatmap, showing how goalies have done on a variety of measures. the last three cover rebounds vs expected and scatter plots. Each viz lets you select 4on5 (penalty kill) , 5on5, or all strengths. You can also vary the Games Played slider control to focus in on starters or backups.
7. Shot Charts
8. General Hockey Statistic Glossary
General
“Rate Statistics” – usually expressed on per 60 minutes basis, e.g. Points per 60 (P/TOI*60). These help aid comparisons between players but can be unstable in small sample sizes, e.g. under 100 minutes.
“Game Strength” – Hockey results vary greatly depending on whether teams are playing at full strength (5 skaters + 1 goalie also known as “5v5”) , or are playing at a special strength, such as a power play (5v4, 5v3, 4v3) or penalty kill (4v5,3v5, 3v4).
Overtime (3v3) and 4v4 are are included with 5v5 when referring to “even strength”. Many reports also include pulling the goalie as even strength (6vs5). For this reason, you should be careful in understanding which game strength is being used.
“On-Ice Statistics” – refers to statistics that are tied to the results for all skaters on the ice with a given player, usually at 5v5. On-ice CF% (shot share) and on-ice shooting percentage are examples. They can be shown as raw counts, rates per 60 minutes, relative to team, or relative to teammates. They are usually shown “adjusted” – this adjusts for score and venue effects. A fuller explanation of relative versions can be found in the SKATR glossary and Guide in section 1 above. The relative to teammate version is usually seen as coming closest to isolating the individual contribution of a player.“Adjusted” – this most often refers to the adjustment of on-ice statistics such as CF% for score and venue effects. (Individual statistics like goals are not adjusted.) Teams who are leading or who play on the road tend to take fewer shots. These are adjusted upwards to try and account for these effects. In the same way, teams who are trailing or who play at home will see their statistics adjusted down.
“Expected Goals” – (xG) each unblocked shot has its location recorded by the NHL. That location plus other information such as shot angle, rebound, time between shots, type of shot, and game strength go into a statistical or deep learning model, which then predicts the probability of a typical shooter scoring on a typical goalie in that situation. These models are built on years of historical data involving over a million shots. The xG of a shot is the probability of scoring and ranges in value from 0 to 1.
Individual Player Statistics
Assists (primary) – (A1) the 1st assist on a goal. More predictive of playmaking than secondary assists.
Assists (secondary) – (A2) the 2nd assist on a goal. More important with defencemen.
Assists – (A) Total Assists = primary assists + secondary assists
Face Off % – (FO%) face off wins/total face offs taken x 100.
Goals – (G) pucks that entirely cross the goal line of the net during legal play.
Goals/60 – (G/60)goals per 60 minutes at the strength stated (All, 5v5, PP, etc)
GP – Games Played
High Danger Scoring Chances – (iHDCF) Any shot attempts with a scoring chance score of three or more. See below for the scoring chance definition. This is the most common definition. Some hockey sites such as MoneyPuck use different definitions, eg. shots with an xG > .2. The main idea is to capture the most dangerous chances which are generally in the “home plate” area in front of the net.
Individual Expected Goals – (ixG). This is the expected goals for an individual player in a game or season. See more about Expected Goals in the General section above.
Points – (P) Goals + primary assists + secondary assists
Points/60 – (P/60) points per 60 minutes.
Penalty Differential – (P+/-) the difference between penalties drawn and penalties taken
Save Percentage – (Sv%) Saves divided by Shots on Goal x 100
Shooting Percentage – (iSh%) Goals divided by shots on goal(SOG) x 100
Shots – also known as “shot attempts” or “Corsi” (iCF). Includes blocked, misses, saves, and goals. Not to be confused with shots on goal which is often abbreviated to “shots” by some.
Scoring Chance – (iSCF) Scoring chances are unblocked shots that meet a certain criteria based on location and other factors. They include the more dangerous “High Danger” category.
Here is the most common scoring chance definition (from Natural Stat Trick Glossary/War-on-Ice):

TOI – Time on Ice, or minutes played.
TOI/GP – the average minutes a player plays per game. It varies depending on how a player is used at even strength and on special teams.On-Ice Statistics
CF – “Corsi For”. Better known as on-ice Shot Attempts For or just Shot Attempts.
CA – “Corsi Against”. Better known as Shot Attempts Against.
CF% – “Corsi For” percentage = CF/(CF+CA) x 100. Known as shot attempt share or shot attempt differential. This measures the percentage of total shot attempts that are made by a player’s team, usually at 5v5 or even-strength. When used as a player statistic, it summarizes the CF% when a player is on the ice.
CF% Above 50% = CF% – 50. This highlights players who are above or below 50%. Players above 50% are helping teammates drive play more than their opponents. The above 50% stats were created for the Maple Leafs Report, to allow them to be included in the scale of the chart with other stats and to be easily understood by newcomers to advanced stats.
DQI – Defensive Quality Index. This is a stat I constructed for the Rolling trends viz, to better understand the quality of defense – ie the ability to minimize expected goals against given a set shot volume. It gives credit to blocked shots as well. Formula: 1 – xGA/CA. A team that lets every shot attempt score (xGA=1) would get a value of 0; a team that reduces every shot attempt to an xGA of 0 (or blocks an attempt) would get a value of 1. Most teams are generally around .95.
SCA – Scoring Chances Against
SCF – Scoring Chances For
SCF% Above 50% – SCF/(SCF+SCA) x 100 – 50. Scoring Chance share above 50%. Players above 50% are on the ice for more scoring chances than their opponent. See Scoring Chance definition in the individual section above.
xGF – Expected Goals For. Includes the expected goals for all teammates on the ice with the player. See more on expected goals in the General section above.
XGA – Expected Goals Against. Includes the expected goals for all teammates on the ice with the player.
XGF% – Expected Goal Share = xGF/(XGF+xGA) x 100. Includes all players on the ice with the player. Very similar to the CF% explanation above except that each shot’s xG is used instead of a “1” weight for each shot. Players with an xGF% above 50% are on the ice for a greater share of expected goals than their opponents.
xGF% Above 50% = xGF/(xGF+xGA) x 100 – 50. Expected Goal share above 50%. Players above 50% are on the ice for more expected goals than their opponent.