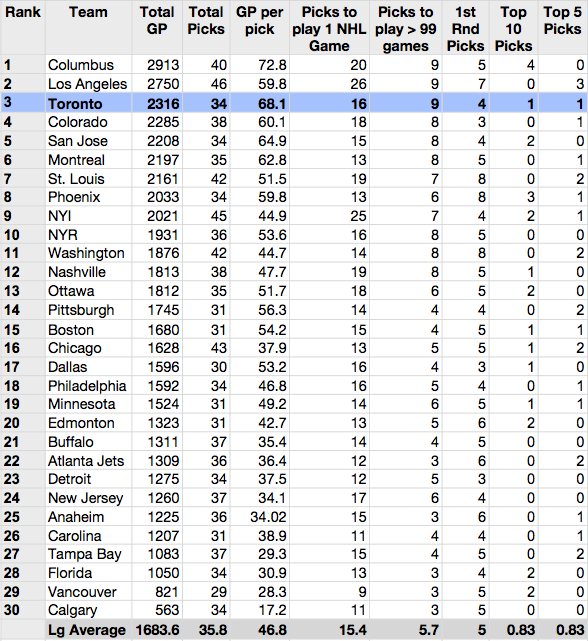
The obvious follow up to the total points draft chart from yesterday is a look at the total games played and games played per draft pick. Results after the jump.
– One thing to keep in mind: Teams that have been perennially competitive and choose/prefer to take the slow boil approach to prospect development may have their draft hauls understated in this exercise. It’s obviously early returns as far as most of these draft classes go. At the other end of the spectrum, teams that provide ample opportunity to their youth may have theirs inflated (NYI has 25 picks who have played at least a game in the NHL). Would the Leafs have kept Luke Schenn at 18 if they were more competitive back then? It’s something to think about.
– Naturally, a number of teams to draft big name offensive talent near the top of the draft (Boston, Chicago, Pittsburgh) dropped in comparison to their Pts standing. As hypothesized on the last post, Ottawa and Detroit both improved by the GP measure.
– The 2012 Stanley Cup champion Los Angeles Kings stand out as having a very strong five drafts with both factors considered, helped of course by their hoarding of picks (46 picks).
– The Leafs moved up from 14th in total pts to 3rd in total games played by their 2005-2009 draftees.
– The Leafs placed second in GP/pick with 68.1. They were 9th in Points/pick.
– The Leafs drafted a high number of solid NHL contributors despite only 34 total picks and 4 first rounders (nine players, so far, who have exceeded 99 GP.. I included Kadri at 99 exactly). The GP credit for Rask and Reimer helped vault them up the rankings as well.
– The Leafs‘ 2006 draftees have played 1040 games alone… a great draft for Dave Morrison in his first year running the staff.
– Here’s a link to the Leafs’ draft history if you want a closer look at the individual numbers.
Here was the Total Points chart for comparison:


