


This article is being co-posted on Maple Leafs Hot Stove as well as on my own site, www.originalsixanalytics.com. Find me @OrgSixAnalytics on twitter.
In my last article, I walked through what the WAR/GAR metric is, as well as the practical applications and limitations of using it to evaluate individual players.
In this post, I would like to build on that work to (i) show how to use GAR to quantify what a player is worth in dollars, (ii) introduce the concept of ‘contract arbitrage’, and (iii) use that concept to review the cap efficiency of Jonathan Toews, Dion Phaneuf, P.A. Parenteau and Brad Boyes.
GAR and Quantifying Player ‘Value’
In a salary-capped league, NHL franchises operate under a series of constraints:
- Maximum of 50 contracts per team
- $71.4M salary cap in 2015-16
- $52.8M salary minimum
- Minimum NHL-level salary of $575K
- Maximum NHL-level salary of $14.3M (20% of the cap)
- Maximum Entry Level Contract (ELC) base salary of $925K, or $3.78M after performance bonuses
As you can see, the Collective Bargaining Agreement (CBA) defines the limits that teams must optimize within. When faced with this, the concept of opportunity cost becomes extremely important. Opportunity cost is the implied cost of a decision by not choosing the next-best alternative available at the time. Think of signing a 35+ year-old to a five-year, $35M deal. Even if that player is a strong contributor, the team’s opportunity cost (five years of losing ~10% of their cap) will often make these deals unjustifiable, especially as that player’s performance declines over time.
Having looked at GAR and player evaluation, I now want to incorporate contract dollars to show how to use GAR to quantify player ‘value’. To do this, I will be focusing on salary cap impact (rather than annual salary paid), as that is what matters to teams when making contract decisions – at least those that aren’t more constrained by their own finances than the cap (e.g. ‘budget’ teams). As you may know, salary cap hit is calculated by the league as the average annual value (AAV) of a player’s contract.
The central approach I will be using to value players is based on some very helpful past analysis by Eric T and Hawerchuk. Amongst many other things, their work showed us the following:
- 1 win (WAR) = ~6 goals (GAR)
- Based on the free agent market and the current cap, every 1 WAR a player contributes is worth $2.8M in contract value.
- After adding in the baseline salary ($575K minimum contract, AKA a zero-GAR player): the market ‘price’ of a 1 WAR or 6 GAR player is approximately $3.4M in player salary per year.
Estimating Player Value: Some Initial Examples
One way to connect our $2.8M cap-dollars per win to players is to simply insert it into the table I shared in my last post. Doing so will give a range of estimated player ‘value’, shown in terms of contract dollars against the cap.
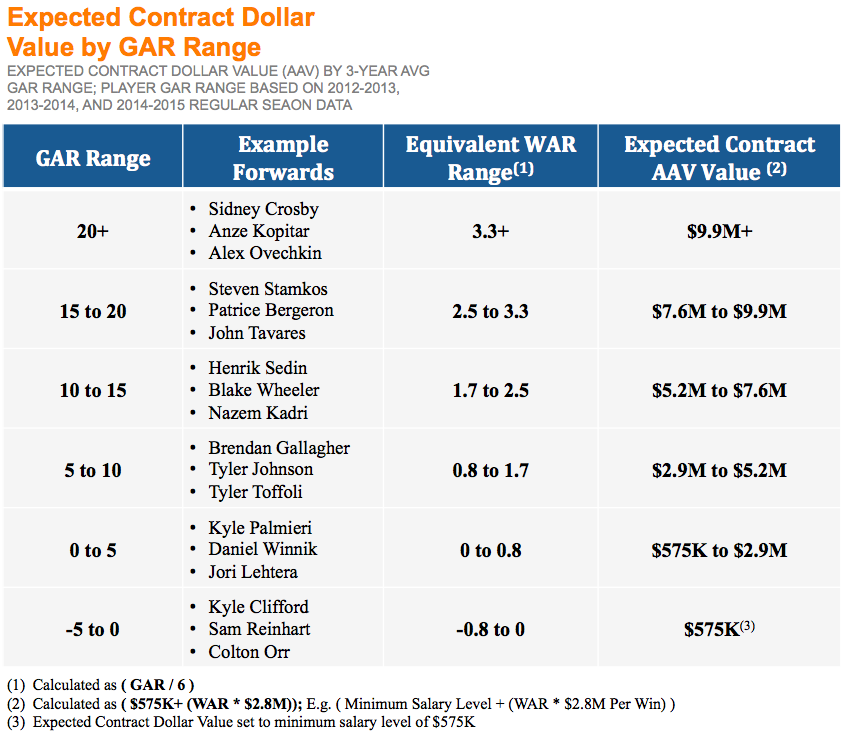
Hopefully this table helps demonstrate an initial idea of what these players are ‘worth’, based on their GAR scores. However, much like my previous draft-pick-value analysis, what works well for a range is not necessarily as applicable on an individual basis. Instead, showing this on a curve can help us assign players a more precise estimate of the value they contribute, and deserve.
The Cap Efficiency Curve
To demonstrate this, I have created the chart below, which I will call the ‘Cap Efficiency Curve’. This curve illustrates the linear relationship between a player’s cost (in contract AAV) and the GAR/WAR a team should expect from an individual with that level of compensation:
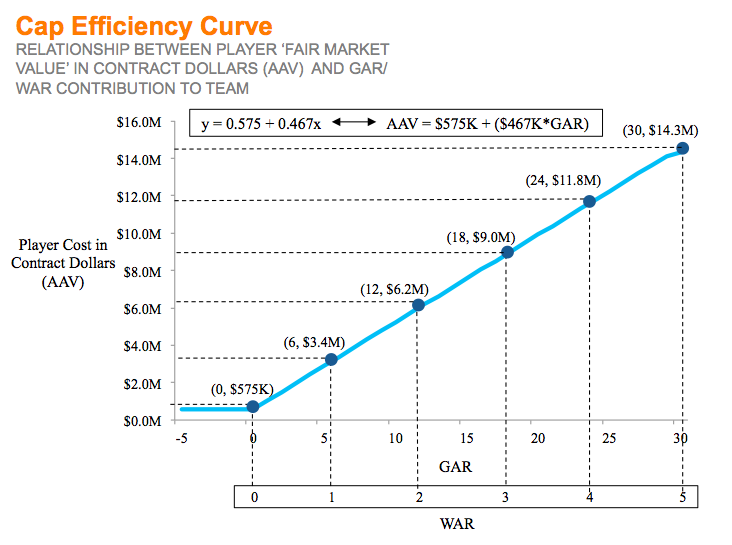
The relationship shown above is relatively straightforward, directly derived from our earlier concepts – that each 1 WAR/6 GAR is worth $2.8M in AAV, above the player’s minimum salary. Hopefully this visualization can help turn the general relationship into an intuitive, usable tool for a team. For example, this curve allows us to:
- Evaluate if a player is outperforming/underperforming expectations in his existing contract.
I - Define the ‘fair’ market price for a player’s future contract, based on what he has been able to do historically, and ideally, based on what we can project he will do in the future.
One note: as you can see, the equation above only holds between the minimum and maximum player salary levels, as a player currently cannot be paid less than $575K or more than $14.3M per season.
Now that we have a good understanding of what a player is worth – how can a team leverage this relationship to ensure they use their cap space as efficiently as possible?
‘Contract Arbitrage’: How to Take Advantage of Market Inefficiencies
The word ‘arbitrage’ can have multiple meanings, depending on whether it is being used in a very technical, financial sense, or a more general one. More generally, people use arbitrage to mean buying something for less than it is worth. Like a typical ‘value’ investor, this is done by conducting detailed research to figure out an asset’s ‘true’ value, before searching for opportunities to acquire it at a very good price. After purchase, value investors typically hold assets (companies) for a very long time, often continuing to invest their dollars, time and expertise in order to maximize future growth, profits, and investment returns.
Applying this value investing arbitrage to the world of NHL contracts brings me to the idea of ‘Contract Arbitrage’. I will define ‘Contract Arbitrage’ as any situation where a team receives more value from a player’s contract than it costs them. Specifically, that would mean earning more in WAR/GAR than the team gave up in equivalent cap-space, making contract arbitrage a measure of cap-efficiency as much as it is ‘financial’ value. While GMs are most obviously focused on acquiring talented hockey players, a key component of the job of a GM is to maximize his team’s wins per cap dollar spent.
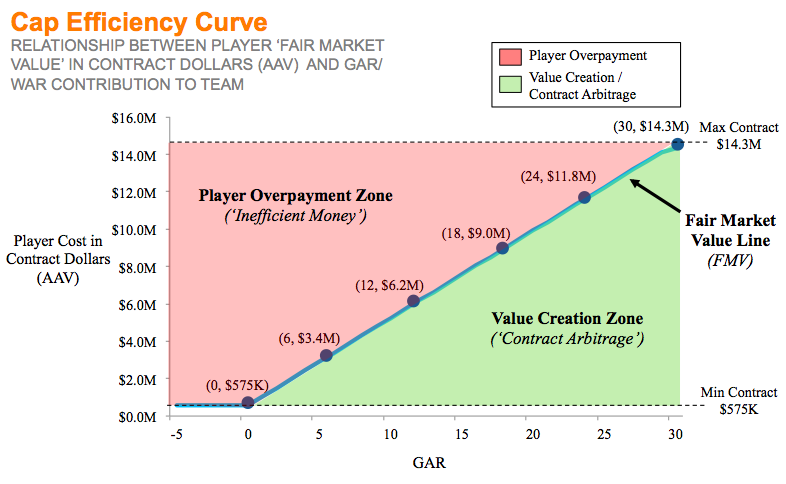
Let’s go back to the Cap Efficiency Curve to illustrate this concept:
Looking at the above:
- Fair market value (FMV) for a player would be any contract value along the curve shown
- Overpaying for a player would be a contract that falls into the area above the curve (shaded red)
- Creating value (e.g. signing a player with the potential for contract arbitrage) would be any contract that falls into the green area, below the curve
- Simply put, the green area represents any time a team pays a player less than the goals/wins he contributed to the team would justify
For simplicity, I will focus my upcoming examples on past performance, in order to illustrate these concepts. In the truest sense, teams should be using this concept on a forward-looking basis. For example, if a team can reasonably forecast a 20-22 year old to reach 10, 15, or 20+ GAR over the next 5+ years, they should be inclined to ‘lock in’ his contract now – ideally within the green area of the chart above. Keep an eye on Aleksander Barkov’s GAR performance over the next few years, as he may grow into an excellent example of such a contract.
Now – let’s get into those examples:
Our Original GAR Case Study: Jonathan Toews
I will start with Jonathan Toews in order to connect this analysis back to the player evaluation case study from my last post. Toews’ 3-year average GAR is 20.3, and his current AAV is $10.5M on a contract with seven years remaining. Plotting Toews’ GAR together with his contract dollars on the curve below will help us see if he is currently being over, or underpaid. The curve will also allow us to see how much over/underpaid Toews is – measured by the distance between his (x,y) coordinates and the FMV line.
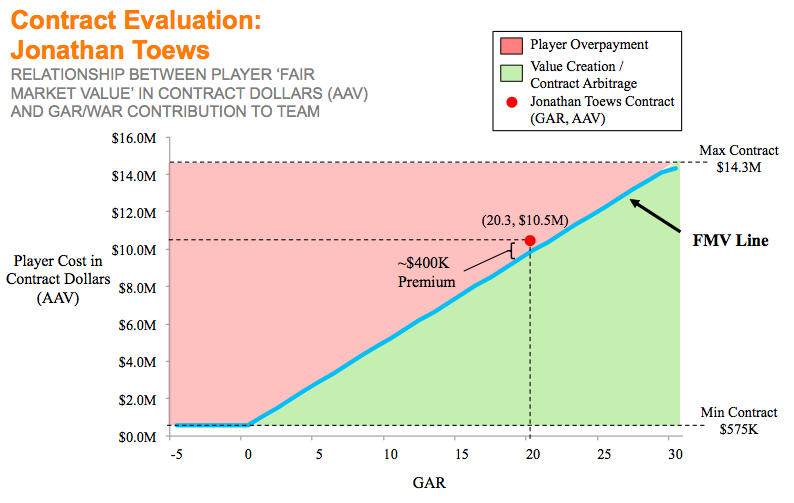
- As shown above, plotting Toews’ onto the Cap Efficiency Curve shows he is ‘worth’ ~$10.1M (e.g. where his ~20 GAR hits the curve)
- Compared to the $10.5M AAV he currently takes of the Blackhawks’ cap, this would show Toews’ to be paid quite close to his fair value, receiving a ‘premium’ of only $400K
Although Toews’ performance has started to show slight declines, I would argue that Toews’ contract appropriately reflects his FMV. Teams will never be able to predict exactly how a player will perform, but the Blackhawks have come pretty close here. Further, this calculation doesn’t attribute any value to qualitative factors, such as the incredible leadership, work ethic, and experience that Toews brings to his team. In my view, these factors will more than offset the $400k premium that the Blackhawks are paying.
Now let’s look at an example at the opposite end of the spectrum…
Former Toronto Maple Leaf: Dion Phaneuf
First, I want to go on the record and say that I had written almost this entire article and analysis of Dion prior to the recent announcement of his trade to the Senators. As a result of that announcement, I now get the benefit of no longer explaining to the world just how bad Dion’s contract is for the Leafs, and how hard it will be for them to offload it. So that is nice.
Second, I will deliberately avoid getting too far into reviewing the trade directly, as there are many other good examples of people who have done so already. My big picture ‘take away’ is that I was very impressed by the Leafs’ ability to source and negotiate a deal that rids them of his contract, with zero salary retained. I also will say that, from the seat of a Leafs’ fan – i.e. supporting a team that has always been overflowing with cash, and is only constrained by the cap – it can be hard to appreciate this deal from the Senators’ perspective.
However, I think the swap has more positives for the Senators than most think. In this trade, the Sens found a creative way to convert very unproductive cap space (injured/inactive players) into a contributing asset (Dion) with a similar cap hit, only for a longer term. Further, James Mirtle’s insightful tweet summarized that the Sens’ actual cash out the door for next season went down by $4.2M after this deal. For a budget team, that cash compensation change is arguably just as valuable as offloading an additional $4.2M in salary cap – all while picking up a solid, top-four defenseman.
Now – let’s take a look at Dion’s contract.
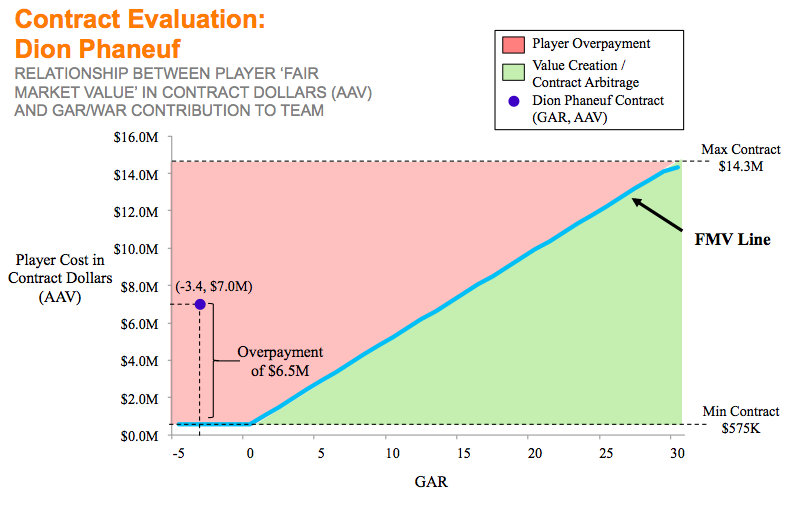
- Plotting Dion’s $7M AAV and his 3-year average GAR of -3.4 (2012-13 to 2014-15) paints a dismal picture.
- Relative to the FMV line, Dion is being paid $6.5M per year more than he contributes to his team’s goal differential.
- The most pessimistic way of looking at this (which I’m sure will make most Leafs’ fans glow), is to directly multiply the $6.5M loss by the five remaining seasons on his deal: giving a total maximum overpayment/loss of value of $32.5M.
However, much like we couldn’t reasonably interpret the first graph as simply ‘Toews is overpaid’, I think we need to caveat this analysis for Dion as well – even if that only results in being nice to Sens fans. To qualify this analysis of Phaneuf’s contract:
- First, as shown in my last post, GAR doesn’t necessarily include every aspect of how defensemen contribute to their teams – thus, it may understate the value of Dion, or any other D-man.
I - Second, this data also only includes up to 2014-15; the eye-test alone makes it clear that Phaneuf has stepped up in the current 2015-16 season. The change in Dion’s usage and minutes under the Babcock regime have likely bumped up his recent GAR considerably – and to Ottawa’s credit, they were buying into Dion’s play this year, not his play over the three years before this one.
I - Lastly, I legitimately believe Lamoriello and Babcock’s comments that Dion was an excellent leader and person to have in the Leafs’ dressing room. I think this was providing a lot more value to the Leafs than us number-crunchers tend to give credit for – and it will be missed.
Going forward, the same analysis above can be applied to see if Dion is living up to his contract any better in the future than he has historically. By tracing his $7M over to the FMV line, we can see that a $7M AAV player ought to be in the 13-14 GAR range each year. Even if Dion’s performance this season (and in the future) is in the 5-10 range, Ottawa may have done a bit better in this deal than we are giving them credit for.
For one last example, let’s look at the free agent signings done this past summer by the Leafs’ current front office:
Brad Boyes and P.A Parenteau
Brad Boyes and P.A. Parenteau are consummate examples of the strong decision-making process and asset management analysis that Shanahan, Lou, Dubas (and likely Brandon Pridham) may be implementing. Boyes and Parenteau each have 3-year average GARs of 5.1, and 5.2, respectively – almost contributing 1 WAR each to their prior teams. On the cost side, Boyes was picked up for an AAV of only $700K and Parenteau for an AAV of $1.5M. Here are the charts to evaluate their respective contracts:
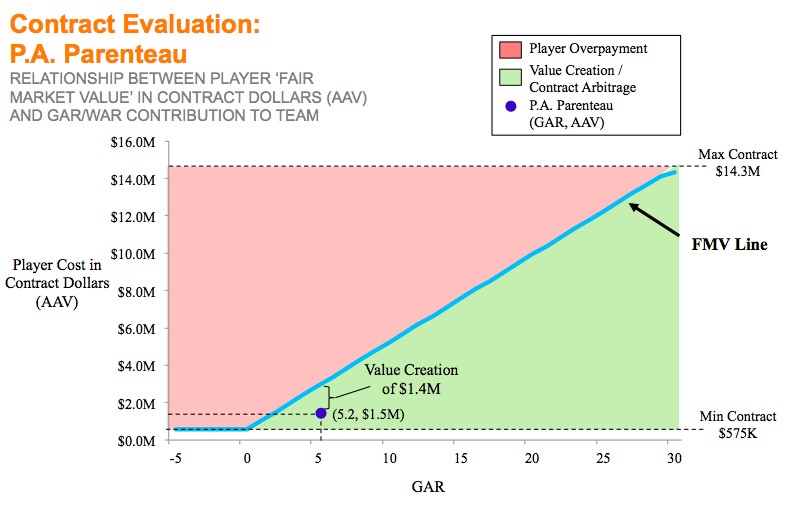
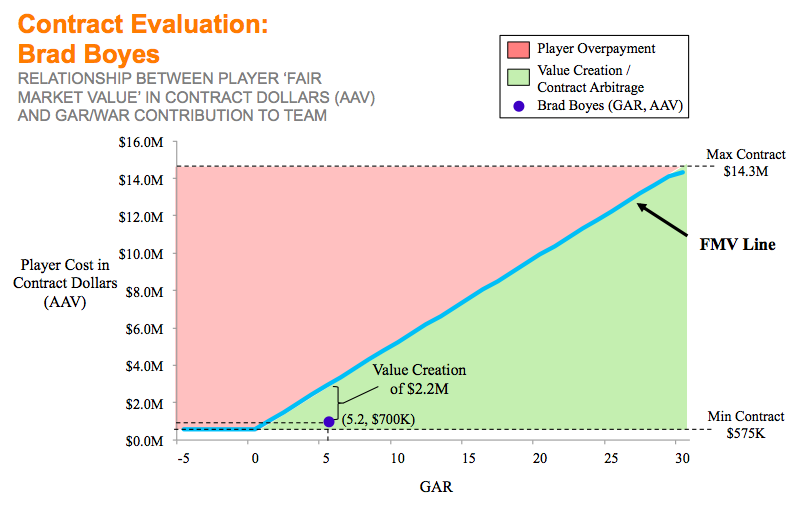
As the charts above show, given the fact that a ~5 GAR player is typically worth $2.9M, as long as Parenteau and Boyes perform in line with their recent history, the Leafs will have immediately created a combined $3.6M in salary cap value when they signed these two players. Further, being more than halfway into the season, the value that Pierre-Alexandre has brought on the ice thus far speaks for itself. Finally, none of this analysis even factors in the potential ‘exit’ value that Lamoriello & Co. could pick up by offloading P.A. or Brad for picks or prospects at the deadline, which is hopefully made easier by their very minor cap requirements.
Conclusion
To wrap up, the great work done by the likes of Hawerchuk and Eric Tulsky has provided us with the perfect framework to dig deeper into using GAR to quantify player value. Hopefully this article has been helpful to walk through those concepts, illustrate what this relationship looks like visually, and to show how the Cap Efficiency Curve can be a useful tool for analysis of player contracts and salary negotiations.
Building on these concepts, within the constraints of the CBA, the most legitimate, ‘fair’ and repeatable way for a team to maximize their cap efficiency is to either focus on acquiring young players in the draft, or by trying to trade for prospects early into their tenures as NHLers. As such, the upcoming third part of this series will focus on how teams can take advantage of entry level contracts and restricted free agency to consistently generate contract arbitrage opportunities for themselves, and maximize their wins per cap dollar spent.


