


This article is being co-posted on Maple Leafs Hot Stove as well as on my own site, www.originalsixanalytics.com. Find me @OrgSixAnalytics on twitter.
@DTMAboutHeart of Hockey-Graphs.com and I recently exchanged tweets about the ‘WAR” metric.

This exchange brought to my attention that, despite the great work that has been done by the creators of WAR, it is a very complex metric. As a result, many don’t know exactly what ‘Wins Above Replacement’ (WAR) is, or how it works in hockey. It also struck me that, currently, much of the hockey community falls into one of two groups:
- Those who don’t know about, or fully understand WAR (or similar metrics), and thus ignore them, and
- Those who understand WAR, but think it is not yet developed enough to fulfill the original single number dream.
(As well as perhaps a third group: teams that are secretly using WAR but not telling anyone… possibly evidenced by the creators of WAR now both being employed by professional sports teams).
As such, I am writing this series as an attempt to amplify the work done in this area. My main objectives are to increase the number of people in the conversation, as well as to demonstrate some of the practical applications, and limitations, of using the WAR metric to evaluate players. I will be focusing solely on the WAR metric developed in 2014-15 by the great team at WAR-On-Ice.com (WOI), who are sadly leaving the public hockey world on March 31st, 2016. For those who don’t know, they are providing access to their entire database’s raw data up until that date. For reference beyond March, I have also uploaded their raw WAR/GAR by season output to my own website.
Further credit is owed to Tom Awad’s work on ‘Goals Versus Threshold’, a very similar stat that the WOI ‘WAR’ metric built upon. Last, I also want to give credit to Moneypuck’s excellent 2015 ‘Building a Contender’ series, where he applied GAR to building a winning franchise, which I have cited multiple times in article below.
So – before I get into WAR itself – why should you care?
Why is WAR Important?
I don’t think anyone will disagree with the following:
- The purpose of hockey is to win the game.
- A team wins the game by scoring more goals than its opponent.
- A player’s ‘ultimate’ contribution to his team is defined by his ability to improve his team’s goal differential (e.g. to increase goals scored and decrease goals against).
Although these three things are very basic, they are the foundation of why WAR is an important metric. It is easy to evaluate players strictly on the stats everyone has readily available: Goals, Points, Assists, etc. However, the classic example of where these fall short is the high-flying scorer who gives up two shots/goals against for every one that he gets. Corsi has become very popular for addressing this through an adjusted, game state-specific plus/minus based on shot attempts. Although Corsi and WAR are built off similar concepts, ‘WAR’ tries to take shot rate metrics like Corsi, combine them with other factors, and then tie the result directly to the column on the scoresheet that matters the most: Wins.
What is WAR?
As mentioned, ‘WAR’ is a metric that attempts to combine a player’s contributions in offensive, defensive and other aspects of the game into the number of ‘Wins’ he contributes to his team. A fundamental concept of WAR is that it constantly compares NHL players to a set of ‘baseline’ expectations. This baseline is similar to looking performance versus league average, though it ends up closer to the league ‘minimum’.
Baseline expectations are important because of player value, and cost: an NHL team should only pay more than a bottom-tier salary if a player is contributing more than bottom-tier results. Thus, ‘baseline’ (or ‘replacement’) level players represent the quality of player that could be acquired for relatively little salary/cost on the free agent or trade markets. WOI calls their method the ‘Poor Man’s Replacement’, as they derive it based on players who have limited NHL experience. Conceptually, these are the players called-up to fill a third/fourth line role when injuries require it.
Finally, in order for WAR to convert performance into wins, we must first derive ‘goals’ contributed. Eric T has shown that roughly ~6 goals = 1 win – directly connecting goals above baseline into wins. Ironically, many people have now realized that ‘Goals Above Replacement’, or ‘GAR’, is actually easier to interpret than WAR, especially for individual players. As a result, from here on I will largely focus on GAR, though you should keep in mind that the two metrics are interchangeable at the rate of 6:1.
One last comment before the data…
A Caveat on ‘Catch-All’ Stats in Hockey
As Michael Lewis’ Moneyball has shown the world, Baseball is the perfect sport for a WAR-type metric. Hitting, fielding and pitching all arguably equate to individual skills disguised within a team game, easily allowing statisticians to separate out individual contributions versus context, and noise.
Hockey, on the other hand, is a sport where it is very difficult to create a single statistic that will summarize ‘all’ of a player’s contribution in one number. As illustrated in this helpful post by Eric T from 2013, it can (conceptually) be almost impossible to perfectly adjust for all aspects of the game at once. However, those who have trudged through the Road to WAR series will see the extreme amount of adjusting for context that WOI has done, where they simultaneously controlled for teammates, opponents, game-state, and many other things – getting all the way down to elements as seemingly minor as travel fatigue (e.g. home/away team performance, and impact of playing on back to back nights). This level of detail and rigor suggests to me that WAR is among the most advanced publicly available stats to date.
Regardless of if you choose to place much value on WAR/GAR, I want to emphasize that no metric will ever justify ignoring other methods of player evaluation. Given WAR/GAR says nothing of a player’s role, Rob Vollman’s player usage charts are a very complementary tool to use alongside it. I also encourage the uninitiated to check out Eric T’s straightforward primer on different metrics that can be used for player evaluation.
Now – back to GAR, and finally, some actual numbers.
What is a ‘good’ GAR/WAR score versus a bad one?
At a high level:
- If a player has a ‘GAR’ of zero – they are equivalent to a baseline/replacement level player.
- If a player has a positive GAR, they are ‘better’ (at contributing to their team’s goal differential) than a baseline player.
- If a player has a negative GAR, they are worse than a baseline player.
In order to be a bit more specific, let’s look at some data from Moneypuck’s series, which was very insightful on this front. His third article looks at:
- The GAR scores of every NHL player from each season in his sample
- The GAR scores of the players from the four conference finalist teams each year
The two charts below summarize his data.
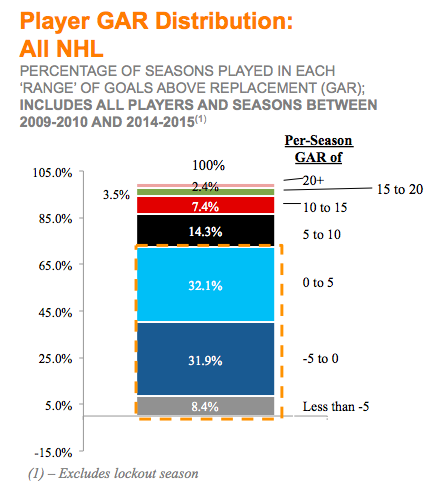
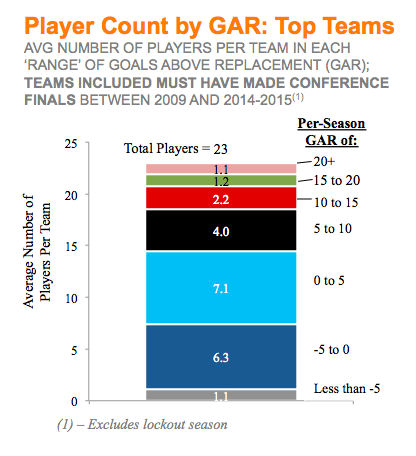
From this data we can make a few observations:
- It is very difficult for a player to pass a GAR score of even 10 in a given season
- The first chart shows that fewer than 14% of players achieve this each year, and the second shows that even conference final-reaching teams usually only have ~4.5 players with a GAR of 10+.
- Even fewer have a GAR of 15+, at approximately 5.9%, or only 1 in 17 players in the league.
- Last – as highlighted on the first graph – over 70% of the seasons played in the NHL score a GAR of 5 or lower.
- Put differently, 70% of NHL players fluctuate in and around the league minimum level of contribution to their team’s goal-differential
Now, in order to illustrate how various players are scoring in terms of GAR – I have summarized the following table for you to compare against your own, personal eye-test.
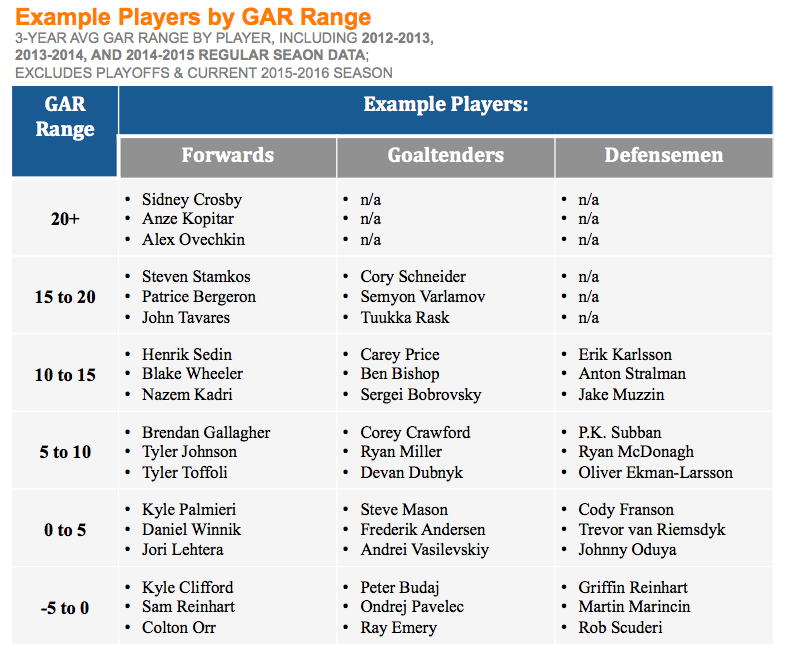
Hopefully this table helps to set some benchmarks in your own mind about how various players score on GAR. This table also makes it clear that Goalies and Defensemen are under-represented in the top GAR ranges, when looked at on a three-year average basis. This highlights an important qualifier of the GAR metric: like most NHL player evaluation, it currently best evaluates a player’s offensive contributions.
Looking at the components of GAR (the next section) will explain why: defensemen will largely contribute to just one or two of the six components (e.g. impact on shot rates), while forwards will contribute to shot rates while also providing material contribution through their shooting percentage, face-offs, and penalty drawing. As a result, when using the current GAR metric to evaluate players, it will be most accurate to compare players within positions, rather than across them. For what it’s worth, WOI previously hoped to add other defensive components to WAR, as well as a measure of play-making ability, helping to offset this gap. However, the closure of their site means these areas will not be publicly incorporated until another brave statistician picks up where they left off.
Now that we know why GAR is important, what a good/bad score is, and who typically scores where – what factors is this number actually considering?
What are the Components of GAR/WAR?
As WAR-On-Ice has already given a very detailed summary of the math behind the metric, I’ll instead focus on the big picture of its component parts. WAR is currently made up of the following six components for skaters, which I have grouped into the three broad categories below:
Offensive Contributions
- Shot rate for
- Shooting percentage
Defensive Contributions
- Shot rate against
‘Gameplay’ Contributions
- Faceoff win percentage
- Ability to draw penalties
- Ability to avoid taking penalties
Whether or not you are familiar with statistics, I think most of us can agree that increasing your team’s shot rate differential, shooting percentage, faceoff percentage, and power play opportunities, while decreasing your team’s minutes on the penalty kill, are all going to help contribute to goals and wins. As a reminder, each of these have their own definition of ‘replacement level’ that GAR is calculated against. One last side note: Goalies are calculated as their own category, based on Sv%, which I have omitted here.
Now, the fun part.
How to Analyze a Player’s WAR/GAR – A Case Study
In order to demonstrate the various components of GAR, I have chosen a player that we all know, and who also happens to contribute at both ends of the ice: star two-way center, Jonathan Toews.
Looking at Toews’ GAR metrics in the 2013-2014 season gives us the following:
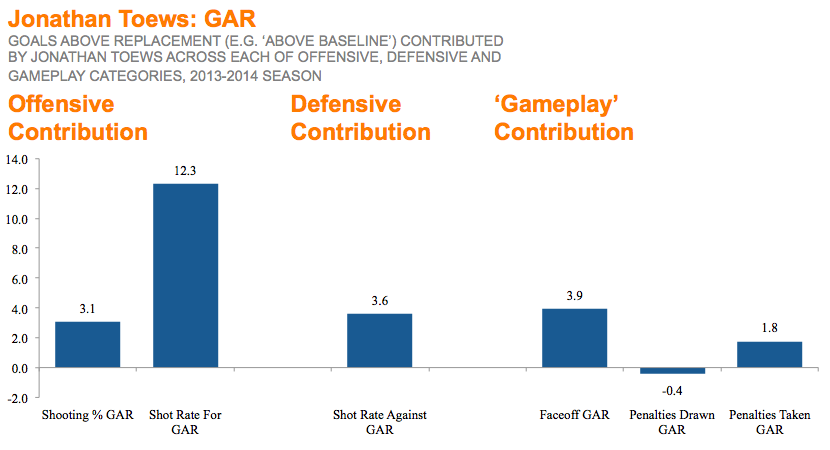
Keep in mind: across all components, a positive GAR is a better result. E.g., Toews’ positive ‘Shot Rate Against’ GAR score (3.6) means he has been successful in reducing shot attempts against.
The above data shows us that:
- Although Toews is a major offensive threat, a significant amount of his impact comes from his defensive and ‘gameplay’ contributions, e.g. shot suppression, face-offs, and ability not to take penalties.
- In 2013-14 Toews won more than half a game (e.g. ~3 GAR) in his faceoff percentage alone, putting him among the leagues’ best.
- Toews contributes most offense through his possession and shot-attempt driving capabilities (shot-rate), rather than by being a sniper.
- In contrast, while not shown here, Patrick Kane contributes more through his strong shooting percentage, often scoring 6-7 GAR per season in Sh% alone.
Introducing a style of chart I will label ‘GAR Bars’, we can summarize a player’s total GAR contribution back into those three major categories:
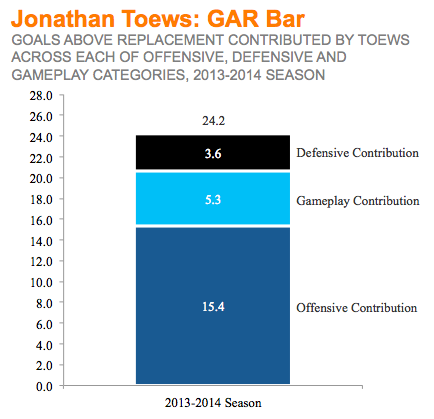
This chart shows the exact same data as the prior one; the only difference is that now I have aggregated each of the six components into their general buckets. For two final illustrations, we can expand on this bar to analyze Toews based on his GAR over time. The charts below show (i) Toews’ absolute GAR contribution over a number of seasons, as well as (ii) Toews’ relative GAR contribution, showing each category as a portion of his total.
Historical Absolute GAR
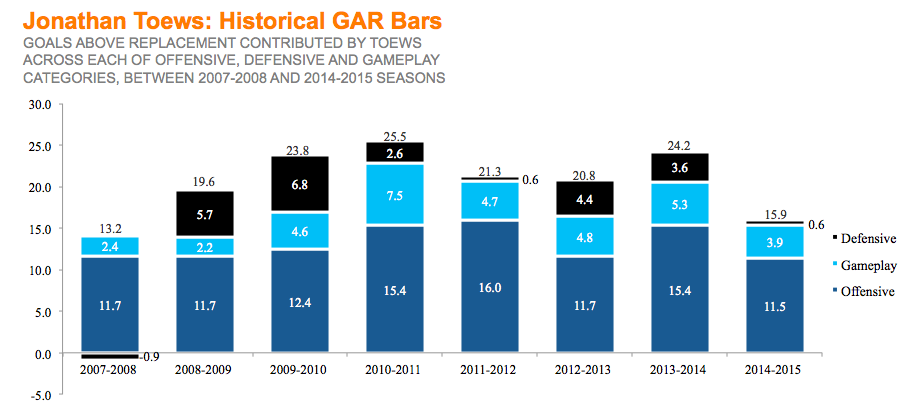
This chart shows us that:
- Toews has been in the 20-25 GAR range for most of his career – an extremely high score, especially when considering only 2.4% of all NHL seasons exceed 20 GAR.
- Despite winning the cup in 2014-15, Toews’ individual performance last season dropped to his lowest level since his rookie year.
- While ~16 is still a very good score, this decline may be indicating signs of Toews’ age, suggesting we should expect a slightly reduced level of performance from him going forwards.
Historical GAR Distribution
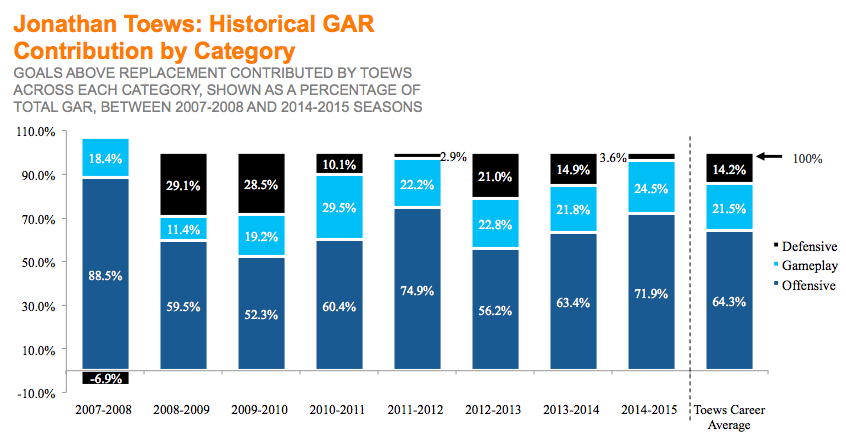
Finally, looking at Toews’ GAR contribution by category shows us the biggest step down in 2014-15 was in his defensive play. Although I haven’t watched enough Blackhawks games to observe this myself, one reason this could be happening is a slight decline in skating ability/speed with age, preventing him from being as involved around the rink as he once was.
Conclusion
Now, I haven’t used this data to hammer home a unique point of view about Toews – no one needed me to quantify it to know he is a future Hall of Fame-caliber player. Rather, the point of this article has been to provide some colour behind the basics of the WAR/GAR metric, and to illustrate in a simple, straightforward manner how anyone could apply this metric to their own thinking on player evaluation.
Regardless, it is clear that Jonathan Toews is a hugely valuable player to Chicago at both ends of the ice, sitting in the elite, 20+ GAR echelon, and having peers among the likes of Crosby, Kopitar, and Ovechkin. This analysis also says nothing about the leadership skills he has demonstrated on and off the ice, taking his team to an unprecedented three cup wins in the last six years. As a result, I think we all believe that Captain Serious earns every dollar of his $10.5M cap hit. But how can we know for sure?
Unfortunately – for that, you’ll have to wait for the next installment of the series, where I will demonstrate how to use WAR/GAR to quantify what a player is worth.


