Where will goals come from? Toronto softened offensively with the moves on the weekend and questions abound about who will put the puck in the net moving forward.
Maybe it’s not about who will make up the scoring; instead, with all these moves – and proved in the 3-0 win over the Devils – in the Leafs case, the best offense, is a solid defense.
By Gus Katsaros
Prior to the new look Leafs taking taking to the ice, the Maple Leafs had the distinction of ranking 5th overall in the NHL in goals scored per game in losses. They scored 2.08 goals per game in losses, trailing only Washington, Atlanta, Columbus and Dallas. While the Capitals are a goal scoring machine (average 4.49 gls/gm in Wins), the Thrashers (3.79), Blue Jackets (3.27) and Stars (3.63) also have an issue scoring goals.
Those ratios are good indications of what plagues those clubs; mediocre to downright horrible goaltending, with a touch of awful team defense. There’s a need to score more goals to make up for lack of backstopping or team defense ability.
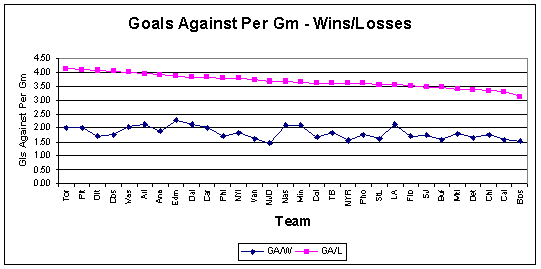
Refering to the charts below, the Devils score an average of 3.14 goals-per-game in wins, and 1.54 in losses. If goaltending falters, they may not have the scoring ability to recover most nights. Similarly with Pittsburgh, if they aren’t scoring more than 1.55 goals-per-game, they’re losing, for the most part.

| Team | Goals For/Gm in Wins | Goals For/Gm in Losses |
| Was | 4.49 | 2.44 |
| Atl | 3.79 | 2.33 |
| Cbs | 3.27 | 2.14 |
| Dal | 3.63 | 2.13 |
| Tor | 4.00 | 2.08 |
| Min | 3.44 | 2.00 |
| SJ | 4.03 | 1.95 |
| Col | 3.50 | 1.92 |
| Ana | 3.65 | 1.87 |
| Car | 4.00 | 1.86 |
| Van | 4.09 | 1.85 |
| Edm | 4.06 | 1.84 |
| Chi | 3.84 | 1.83 |
| StL | 3.50 | 1.81 |
| Flo | 3.67 | 1.78 |
| NYI | 3.48 | 1.73 |
| Ott | 3.52 | 1.72 |
| Pho | 3.33 | 1.70 |
| Phi | 4.14 | 1.69 |
| Buf | 3.50 | 1.68 |
| TB | 3.82 | 1.66 |
| Cal | 3.44 | 1.62 |
| Det | 3.50 | 1.62 |
| Mtl | 3.56 | 1.61 |
| LA | 3.73 | 1.59 |
| Nas | 3.63 | 1.58 |
| NJD | 3.14 | 1.58 |
| Bos | 3.39 | 1.57 |
| Pit | 3.97 | 1.55 |
| NYR | 3.80 | 1.48 |

| Team | Goals Ag/Gm in Wins | Goals Ag/Gm in Losses |
| Tor | 2.00 | 4.13 |
| Pit | 2.00 | 4.09 |
| Ott | 1.71 | 4.08 |
| Cbs | 1.77 | 4.06 |
| Was | 2.03 | 4.00 |
| Atl | 2.13 | 3.97 |
| Ana | 1.88 | 3.93 |
| Edm | 2.29 | 3.86 |
| Dal | 2.13 | 3.84 |
| Car | 2.00 | 3.83 |
| Phi | 1.71 | 3.81 |
| NYI | 1.83 | 3.79 |
| Van | 1.62 | 3.75 |
| NJD | 1.46 | 3.68 |
| Nas | 2.10 | 3.67 |
| Min | 2.11 | 3.64 |
| Col | 1.67 | 3.63 |
| TB | 1.82 | 3.63 |
| NYR | 1.56 | 3.61 |
| Pho | 1.76 | 3.61 |
| StL | 1.63 | 3.55 |
| LA | 2.12 | 3.55 |
| Flo | 1.71 | 3.53 |
| SJ | 1.72 | 3.47 |
| Buf | 1.59 | 3.45 |
| Mtl | 1.80 | 3.42 |
| Det | 1.65 | 3.38 |
| Chi | 1.76 | 3.33 |
| Cal | 1.59 | 3.31 |
| Bos | 1.52 | 3.13 |
If the Leafs are going to be looking for goals up front, especially as they jettison more assets, the deficit could be made up by allowing fewer goals; more specifically, at least one goal per game less would give them a fighting chance to come out with a few extra time points, and upset a few teams along the way.
They may struggle to bulge more twine, but with a concerted effort, they could use the ounce of prevention instead of looking for a pound of cure.
It would be a shame to see the team succomb to a stifling defensive game, but if the Leafs want to make some kind of headway out of the basement – and out of a lottery pick position – a boring, effective style may have to take precedence the rest of the way.


![John Gruden after the Leafs prospects’ 4-1 win over Montreal: “[Vyacheslav Peksa] looked really comfortable in the net… We wouldn’t have won without him” John Gruden, head coach of the Toronto Marlies](https://mapleleafshotstove.com/wp-content/uploads/2025/09/gruden-post-game-sep-14-218x150.jpg)


