


Dion Phaneuf’s effectiveness always seems to be a popular matter of debate in the world of hockey.
This shouldn’t surprise anyone when citing a player who captains an NHL team in a hockey-crazed market like Toronto while carrying a beefy cap hit of $7,000,000 per annum. Last season, Dion was subject to incredibly difficult usage at the hands of head coach Randy Carlyle. His teammate Corsi For percentage of 43.4% was the 16th lowest among all defensemen since 2007-08, while his offensive zone start percentage of 37.7% ranks lower than all but 23 blueliners in the Behind the Net era. As you can imagine, his observable possession rates weren’t pretty. Number 3 in blue and white sported a career-worst CF% of 40.8% (0.3% worse than the infamous Douglas Murray the same year).
The issue is that it’s very difficult, if not impossible, to assess Phaneuf’s 2013-14 performance within the context of his deployment. There simply isn’t a sufficient sample of defensemen who have faced comparably laborious ice time. Another possible factor is coaching. Randy Carlyle has a well-documented track record of dragging down a team’s possession numbers. These two factors intertwined serve as the source of controversy, actively inspiring an array of varying opinions regarding Phaneuf’s value.
The solution to the evident lack of basis for evaluation is grouping Phaneuf’s single season data into two separate three season sets: pre-Carlyle era (2009-2011) and Carlyle era (2012-14). This method normalizes Dion’s usage to an extent due to a larger sample size. It is then possible to analyze Phaneuf’s adeptness given the strain of his minutes and measure the way his observable results have responded to tougher minutes under the tenet of Randy Carlyle.
Pre-Carlyle Era (2008-09 to 2010-11)
It is well documented that Phaneuf’s observable possession rates were much better before Randy took authority behind the pine. His CF% of 51.5% from 2009 to 2011 was good enough for 85th among 316 defensemen who played within the same time frame. On the flip side, his usage was relatively easy in terms of the strength of his linemates, opposition and high offensive zone start percentages. It is crucial that these factors are accounted for before we jump to any conclusions.
A preferable way of doing so involves comparing Dion’s offensive output, specifically Points/60 and Corsi For per 20 (CF20) to twenty defensemen who have been deployed comparably in the past. Comparable players are selected by averaging the number of standard deviations each of their usage variables (QoT, QoC, Zone Starts) deviates away from the usage variables of the player of interest (Dion Phaneuf in this case). It is important to note that the standard deviation of QoT metrics are also applied to QoC metrics in order to avoid overstating the significance of quality of competition which suffers from a serious lack of spread.
Here are Dion’s 2009-2011 production and possession rates matched up against twenty other defensemen who have faced similar deployment within an analogous time period…
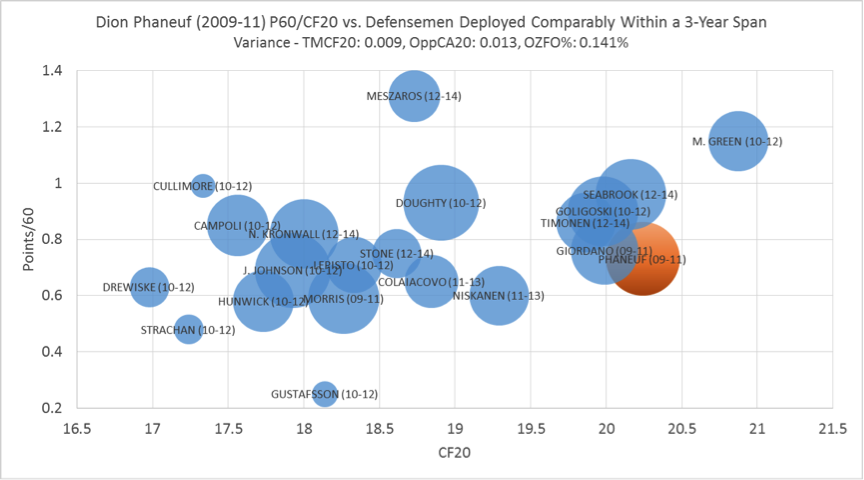
As you can probably tell from the visual, Phaneuf was a key contributor offensively considering the type of minutes he played. His CF20 of 20.243 is only bested by Mike Green’s rate from 2010 to 2012, which was essentially the pinnacle of Green’s career. This means that Dion outperformed the likes of Brent Seabrook, Mark Giordano, Drew Doughty and Kimmo Timonen while playing similarly difficult minutes over a comparable period of time. Production-wise, his numbers weren’t as sexy. Phaneuf’s 0.73 points per hour places better than only nine of twenty blueliners used comparably. That rate stands to be 0.02 points per 60 minutes below the chart median. Overall, we can conclude that Dion Phaneuf outperformed expectations offensively, pre-Carlyle, as his possession rates were excellent and his production was typical given the difficulty of his usage.
Measuring Corsi Against per 20 (CA20) will be our basis for evaluation on the opposite side of the puck. Twenty comparably used defenders (within a 3-Year span) will serve as our measuring stick yet again.
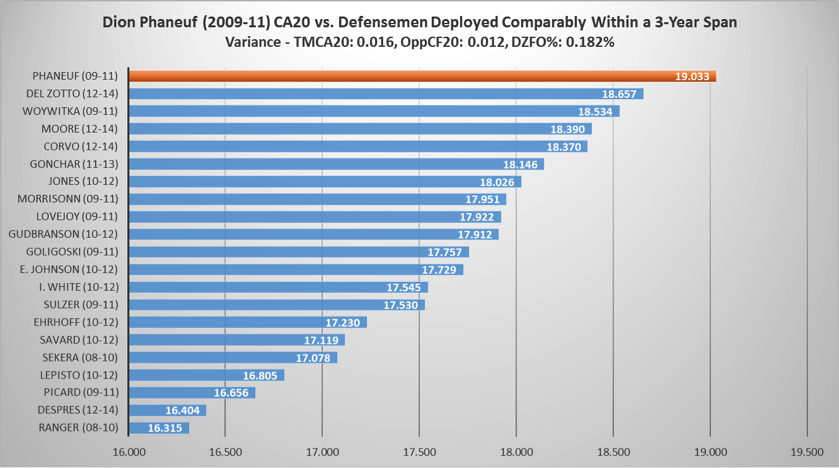
The results are visibly concerning. Dion Phaneuf is vastly outperformed by his twenty closest comparably used defenders. To the extent that Dion’s CA20 sits 1.276 shot-attempts above the chart’s median rate of 17.757. Limited time on the penalty kill and somewhat cushy usage at even strength indicates that Phaneuf’s coaches (Keenan/Sutter/Wilson) were well aware of his defensive inefficiencies. Syndicate his poor observable shot suppression results with his amply impressive shot generation numbers and it becomes clear that Phaneuf was a high event offensive weapon with some serious issues in his own zone in the three consecutive seasons preceding the arrival of Coach Randy Carlyle.
Carlyle Era (2011-12 to 2013-14)
No one saw a more drastic change with respect to the way they were played than Dion Phaneuf following the hiring of Head Coach Randy Carlyle. It seems as though Randy quickly neglected the messages that Dion’s past analytics conveyed. No longer was Phaneuf seen as an offensive player with defensive short-comings but instead a hulking two-way blueliner who played with a mean streak that screamed compete level. Carlyle quickly decided that Phaneuf was going to be Toronto’s source of stability from the backend. In the coming years, Dion would be exposed to top opposition night in and night out. Defensive zone starts radically increased in frequency. He was also given an array of sub-par d-partners that ranged from inexperienced defensemen like Korbinian Holzer and Mike Kostka to a battered Carl Gunnarsson with nagging hip issues.
As expected, Phaneuf’s observable numbers took a major hit. His CF20 plummeted while his CA20 sky rocketed. The goal is to re-access these results by once again comparing them to other defensemen who have faced similar deployment. Once more we will compare Phaneuf’s 2012-2014 production and possession rates to twenty defenders who have faced equivalent deployment within a similar period of time.
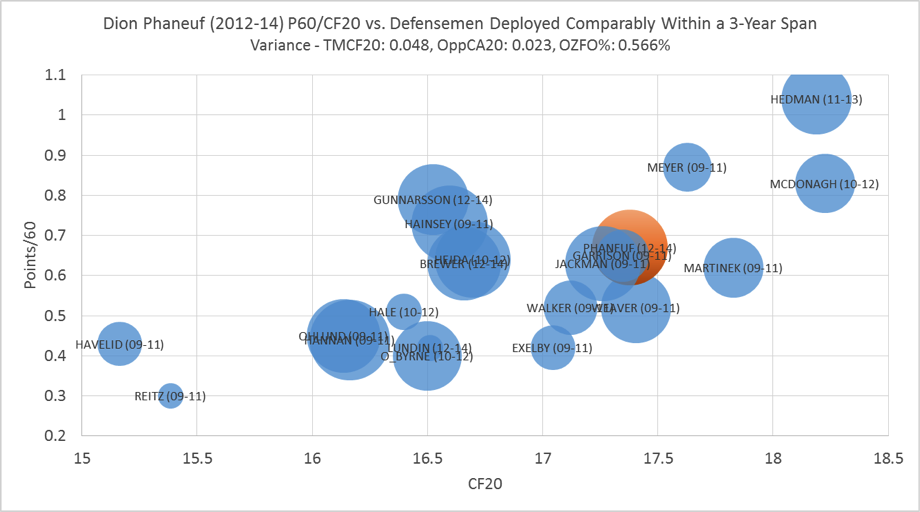
Interestingly, Phaneuf’s CF20 still ranks better than the majority of other defensemen who fit the same usage specifications. While his shot generation results aren’t as striking as they were pre-Carlyle, they are still above expected. His production has also slightly decreased since Randy’s arrival, but it has actually improved relative to those who have historically been used in a similar fashion. The takeaway here is that Phaneuf is likely still an adequate offensive option. The drop in his raw shot generation results are virtually proportional to the increase in the difficulty of his minutes.
Comparing Dion’s Corsi Against per 20 minutes to comparably used defensemen suggests that he hasn’t changed much defensively either.

Dion surprisingly places marginally better defensively this time around. Conversely, he happens to be 1.693 CA20 above the chart median of 19.819 which is actually a worse deficit than he managed pre-Carlyle. It doesn’t seem fair to say that Phaneuf has suddenly become a train wreck defensively. Defense has always been an area of concern (Random note: T.J. Brodie is a beast).
Conclusion
A closer look at Dion’s underlying numbers, within two very different chapters of his career, lead us to the same conclusion: Phaneuf is above-average offensively and abysmal defensively. A victim of miscalculation. One now being used in a way that would ironically flatter a defensemen with a polarizing skillset. The perfect example of hockey minds falsely assuming that physicality equates to defensive efficacy.
There is no denying that Carlyle’s reliance on Phaneuf was one of the main reasons why Toronto surrendered 34.9 shots against per 60 minutes at even strength last season. Randy has hinted at lightening Dion’s workload heading into the 2014-15 regular season. We will see if Carlyle can avoid temptation and remain true to his word. Phaneuf has also been moved to the left side in an attempt to keep him off of his backhand and ultimately make breaking out of the defensive zone an easier task. A somewhat counter-productive move considering the fact that Dion has historically been more productive on his off-side. An offensive defenseman like him needs to be placed in a position that maximizes offensive output and hopefully the Leafs’ recent adoption of analytics can inspire a decision to do exactly that.


