


This article is being co-posted on Maple Leafs Hot Stove as well as on my own site, www.originalsixanalytics.com. Find me @OrgSixAnalytics on twitter.
In my last post, I shared some analysis on long-term player performance and development based on draft round.
As a follow-up to that article, I’d like to do two things: first, I’ll convert my last analysis into a relatively straightforward and ‘usable’ metric for draft pick value. Then, I’ll apply this metric to two short case studies in order to illustrate who won each of the Toronto Maple Leafs‘ draft day trades this past summer (hint: it wasn’t Ron Hextall or Jarmo Kekalainen).
Draft Pick Value
The third and final objective from my original report posed the following question:
• How much more valuable is a pick in the first round versus the other rounds? All things being equal, what should a pick from each round be worth in a trade?
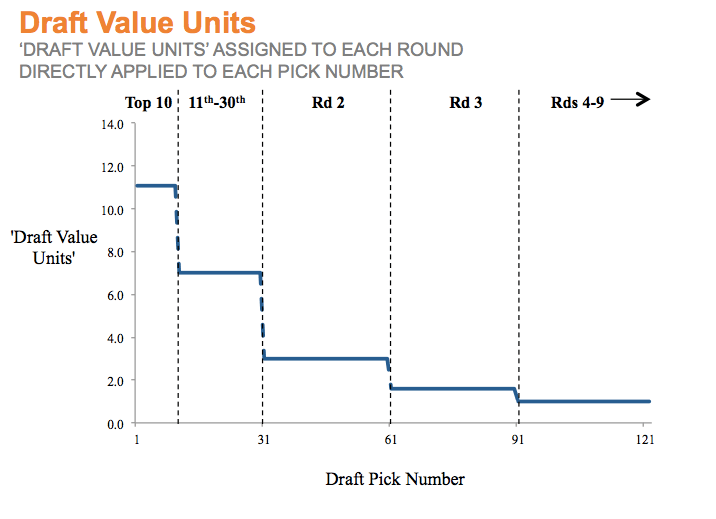
Building on the analysis done by others mentioned in my last post, the chart below summarizes how I have approached ‘converting’ long-term performance data into a relative draft pick value metric. To be clear: I am not proposing the values shown in this chart; rather, I hope to use this chart to illustrate the methodology I have applied across a number of metrics.
Games played data is one metric that can inform relative pick value by draft round:
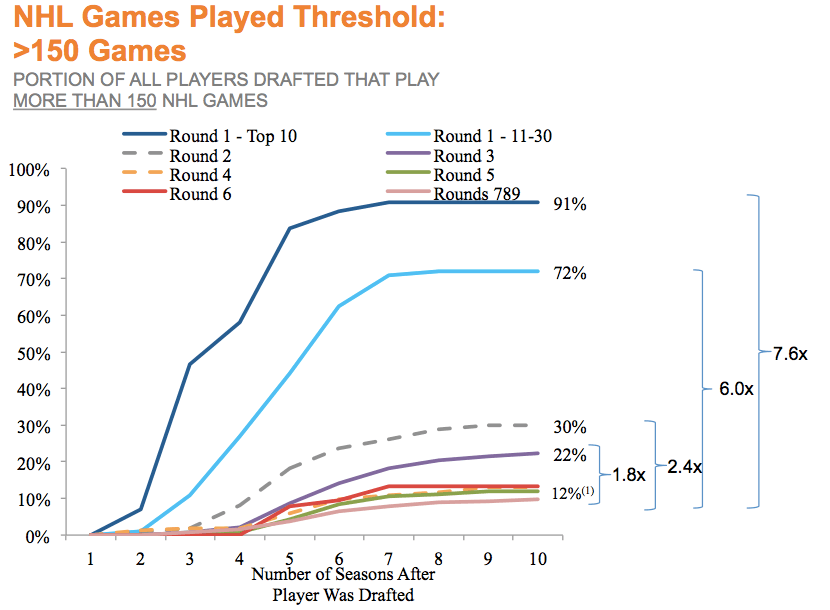
- The chart above shows how likely a player from each round is to play ~2+ seasons in his career, and by when he should be expected to do so.
I - The chart then calculates how much more likely a player from each round is to pass 150 GP than the bottom cohort of rounds (e.g. average of Rounds 4-9) – shown as a multiple of those rounds.
I - Thus, if we define a pick in rounds 4-9 as the ‘base unit’ (e.g. ‘1.0 units’), using the >150 GP threshold shows a third round pick to be worth 1.8 units, a second round pick being worth 2.4, an 11th-30th overall pick being worth 6.0, and a top 10 overall pick being worth 7.6.
Applying this approach to multiple metrics will give us a more robust view of relative pick value:
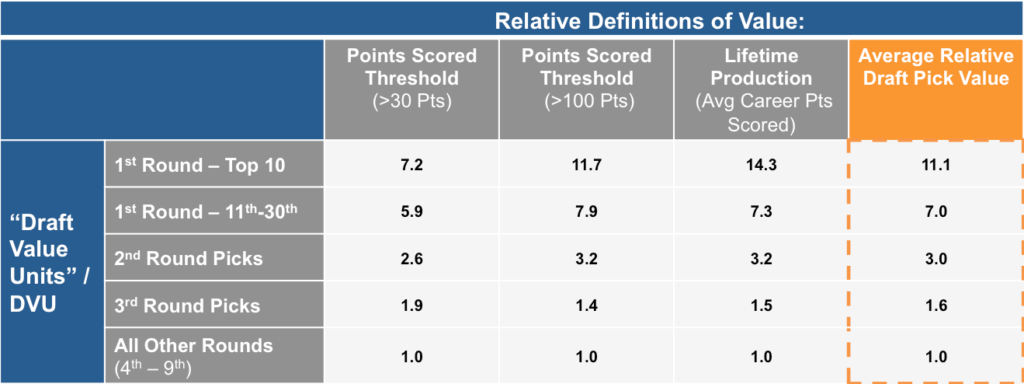
- The table above shows the ‘Draft Value Units’ (working name) of a pick in each round across three metrics: >30 Pts, >100 Pts, and Average Career Pts. In essence, ‘Draft Value Units’ are comparable to a currency with which teams can value and exchange draft picks.
I - As mentioned – each round is shown as its multiple of the lowest group (Rounds 4-9) – and most of my attention going forward will be on the far right, highlighted column; also, all of the values of this chart are derived from the data shown in my last article.
I - As Michael Schuckers and Stephen Burtch previously showed, this data suggests teams should use caution when trading their first and second round picks, as they are many times more valuable than the other rounds.
I - It is worth noting that Lifetime Production data can also shed light on ‘absolute’ pick value; e.g. in a trade for active players, a pick in the top 10 overall should be treated as if it has a career lifetime value of ~350+ points as a forward, or ~170+ points as a defensemen – something directly comparable to ‘remaining’ production in an active NHLer.
Part of the goal of this exercise was to create a pick valuation methodology that is highly simple, and usable by many, regardless of their level of analytical sophistication. As someone very familiar with the world of corporate finance and valuations, I can tell you first hand that – despite financial firms using the ‘fanciest,’ most complex valuation models you could imagine – the most effective of these models will often reduce complexity, rather than create it.
All investors and bankers also know that valuation analysis is a ‘blunt’ tool, and it will never give you an exact, ‘true,’ intrinsic value for a corporation or a stock (i.e. picture using an axe to carve a statue). I think the same thought process applies to this draft pick value methodology – it is directional, rather than exact, but hopefully it also intuitive to understand and apply. My general philosophy is that decision makers do best when considering metrics that are reflective of the big picture, while simultaneously weighing those against the typical qualitative information they bring to the table, such as team needs, player skill, size and character.
Now – let’s get into the deals.
Draft Day 2015 Deal #1 – Dubas and Hunter vs. Ron Hextall of the Philadelphia Flyers
After seemingly endless conversations and hustling around the draft floor, Dubas and Hunter’s first trade of the day was with Philadelphia:
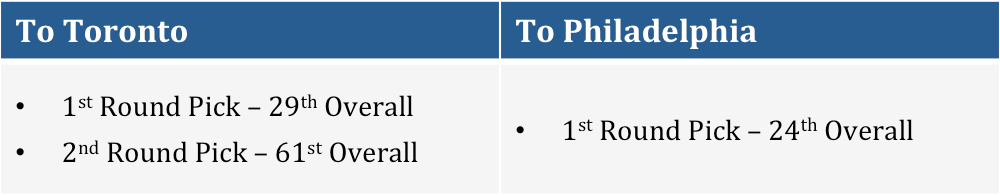
Now, based on the far right column in my ‘Draft Value Unit’ table above, we would think to assign the following values to these picks:
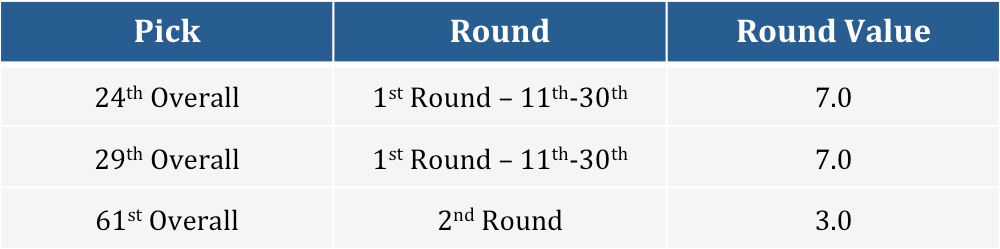
Huge win for the Leafs, right?
Not necessarily. As we all know, and as Schuckers and Burtch’s analyses clearly demonstrate – all picks in each round are not created equal. The 11th overall pick is not equivalent to the 30th, even though the table above would be treating them as having the same value. Because of this, the Draft Value Units shown above would be most appropriate to use when a trade is done well in advance of a draft, and it is not known exactly which overall draft number a given pick will relate to. In order to make this metric meaningful to trading ‘known’ pick numbers, we will have to do some adjusting.
Applying ‘Draft Value Units’ directly to draft pick numbers will show some counterintuitive results:
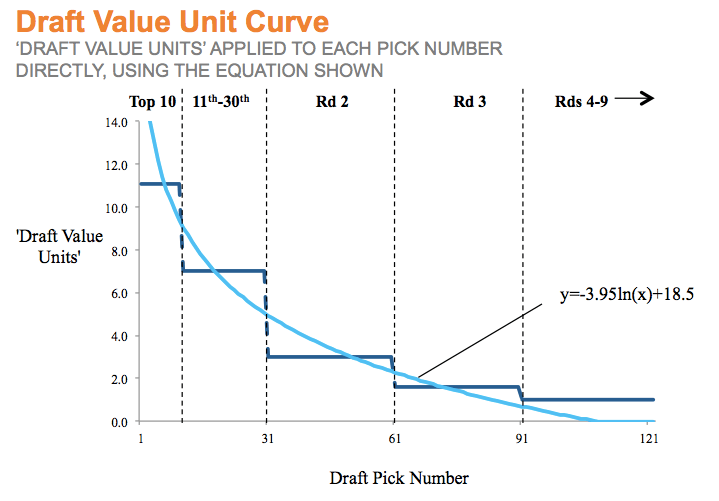
Instead, for individual pick numbers, we need to ‘fill in the gaps’ with a new curve, equivalent to the equation shown below:
- Once we do know what pick numbers each team will have, we need to adjust the value of each pick appropriately.
I - To do this, I have derived the solid, light blue line in the chart above, which best fits the original Draft Pick Values shown.
I - This line shows what the appropriate Draft ‘Value’ is for a pick once we know the exact pick number that it relates to.
I - The line was derived by looking at the (x,y) coordinates of each pick number and its respective Draft Value Units, after assigning the values in the first table shown to the mid-point of each round (e.g. 5th overall pick being worth ~11.1 DVUs, 20th overall pick being worth ~7.0, etc.).
In order to test validity, we can compare this curve/equation to those derived by Shuckers and Burtch. The similarities between the three draft value methodologies help to support the accuracy of the findings of each. Note – the one downfall of this curve is that, in order for it to appropriately reflect the value of the first 100 picks, the DVU’s hit zero around pick 100. As a result, my advice for those trying to use this to value picks from the 4th round and onward is to treat each pick as having a Draft Value of 1.0 units, rather than zero (e.g. revert back to the dotted line).
Now, back to Leafs vs. Philadelphia.
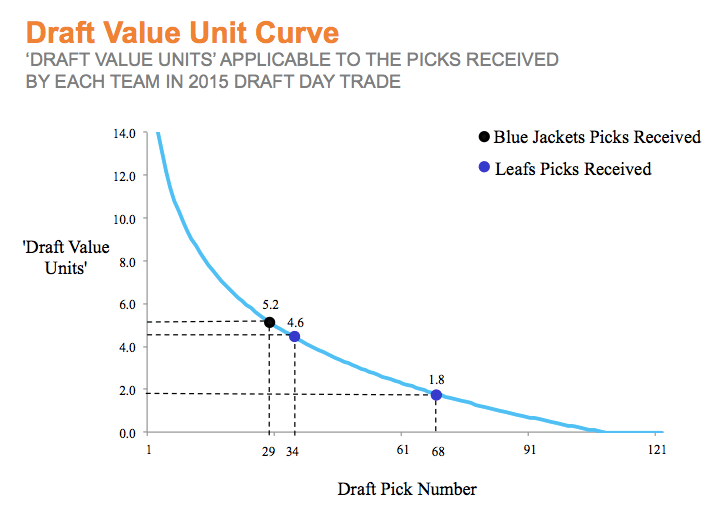
Plotting the three Leafs/Flyers picks traded on our curve shows the value of each individually:
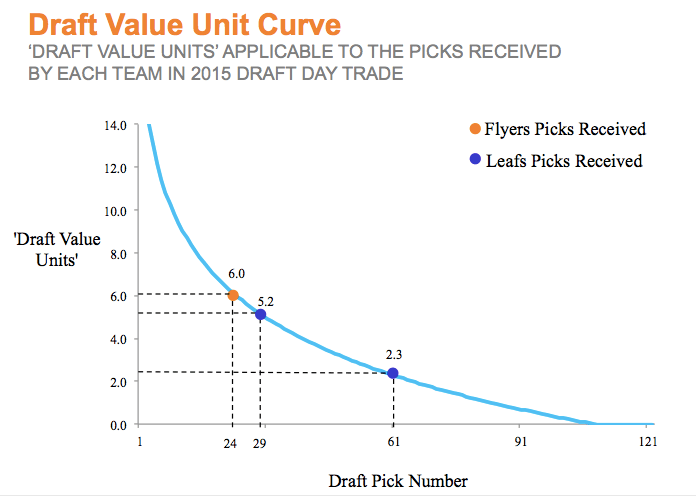
- The chart above shows that the theoretical value of the 24th overall pick is 6.0 DVUs, with the 29th and 61st overall being worth 5.2, and 2.3, respectively.
I - As I did here, in order to use this on any other trade, all you have to do is find each pick number on the x-axis, trace it to the curve, and then trace that point on the curve back to the y-axis, giving you the Draft Value Units of that pick.
I- The end of this article also has a table showing Draft Value Units for each pick number, e.g. the coordinates that make up this line
On an expected value basis, the Leafs won the trade with Philly by 25%.
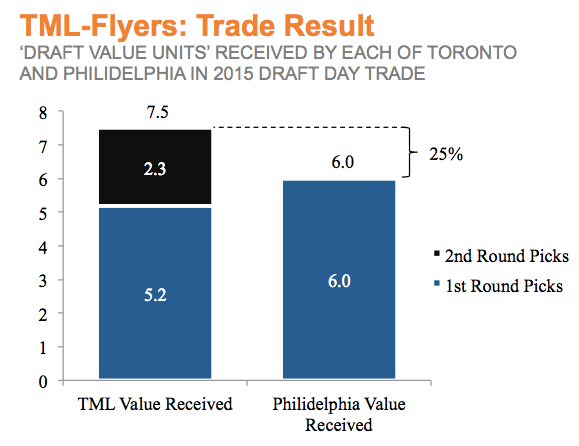
- Based on the values assigned above, the Leafs were the clear winners of this trade.
I - As a reminder – these Draft Value Units originate based on an average of the probabilities for each player drafted to do three things: 1) Exceed 30 career points, 2) Exceed 100 career points, and 3) Maximize their lifetime (point) production
One last important thing to point out – as I’m sure many Flyers fans and general non-stats folks will want to discuss – the Flyers executed this trade because they badly wanted to pick Travis Konecny, of recent Canadian World Junior ‘fame.’ They saw him as materially better than their next choice (if they had picked 29th) – Nick Merkley. This piece isn’t about scouting or individual player evaluation, which are of course important factors to consider. Generally speaking, every team should be drafting with a broad strategy in mind that drives towards filling its specific needs (which I’m sure justified this trade from the Flyers’ perspective). The point of this analysis is to say that – on a long term, expected value/probability basis – a team will do better to be on the Leafs’ side of this trade. Even if 10 years from now Konecny is the next John Tavares, and everyone thinks Ron Hextall is a genius, I think the Leafs were on the right side of this trade based on what was known on draft day.
(As a side note: this article by Travis Hughes gives a bit of background about Philadelphia’s rationale for being so eager to trade up for Travis Konecny).
So far, Leafs 1, League 0
Draft Day 2015 Deal #2 – Dubas and Hunter v. Jarmo Kekalainen of the Columbus Blue Jackets
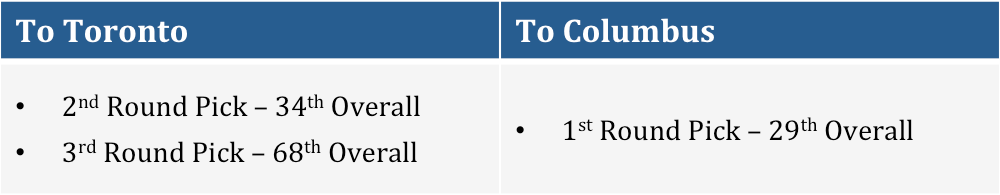
It didn’t take long for Dubas and Hunter to turn around and offload their newly acquired 29th overall pick either, employing a highly similar strategy in their trade with Columbus:
Now if we apply the same analysis here, looking at the value of each pick individually:
It is clear the Leafs ‘won’ this deal, too – by 23%.
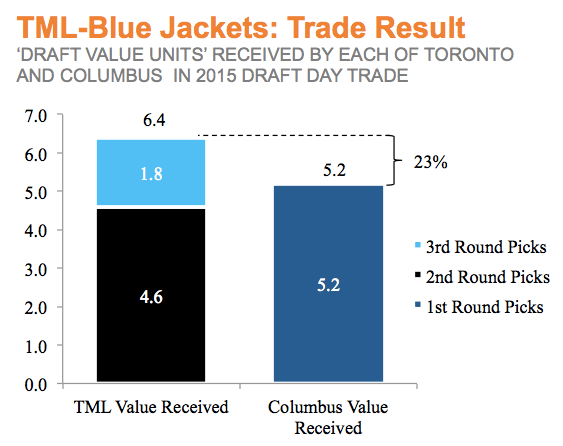
You don’t need me to tell you too much more, as the same analytical framework shows the Leafs fared similarly well in their trade with Columbus as they did with Philadelphia.
Before I wrap up, just for fun let’s look at the two deals as whole.
Putting the Trades Together
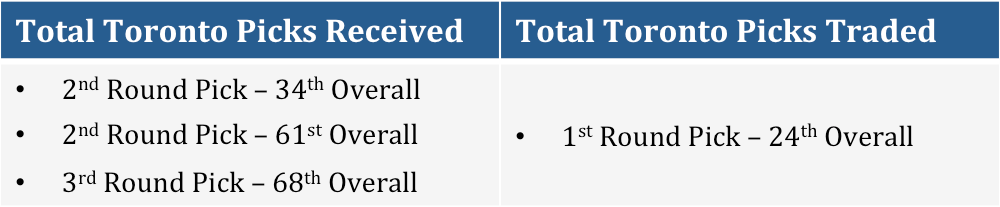 The Leafs’ two trades during the 2015 draft created an incremental two players, 2.7 draft value units, or otherwise a 43% increase in relative value.
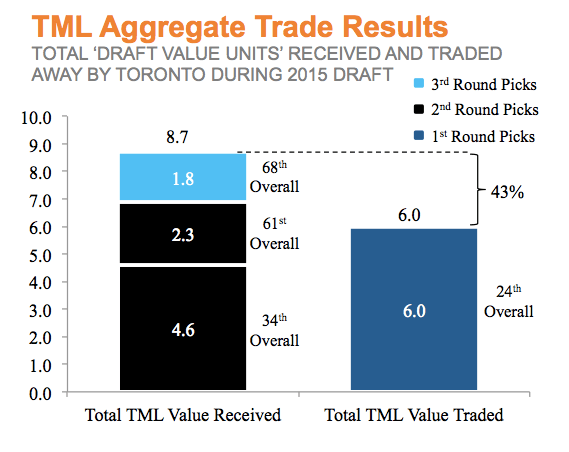
By the end of the draft, the Leafs had used these three picks to select Travis Dermott, Jeremy Bracco, and Martins Dzierkals, based on the scouting expertise employed by Hunter and his team. It also helped fill some of the team’s draft objectives early on, enabling them to wait it out for sleeper picks like Dmytro Timashov in the fifth round – a player who has turned many heads at the recent World Juniors. I wouldn’t (yet) go as far as to say that Hunter has a legitimate ‘advantage’ over other teams in player scouting and evaluation until more time has passed. However, Dermott’s OHL performance this year and recent World Junior selection also suggest that getting him at 34th was also a bit of a steal in its own right. Regardless, it should be clear that on this fateful day last June, Kyle Dubas and Mark Hunter made some excellent decisions, which created a ton of value and long-term potential for the Toronto Maple Leafs club.
Also, I won’t go into it in depth here, but how did the Leafs acquire that original 24th overall pick? The Leafs got it by trading two ‘rental’ players (Franson/Santorelli), who were both about to become UFAs, in return for that first first pick, Brendan Leipsic (another solid prospect), and Olli Jokinen’s cap space. Keep an eye out for the Leafs’ front office to hopefully make a couple similar deals approaching the trade deadline this year, and repeat their excellent 2015 performance next June.
Leafs 2, League 0.
Conclusion
When considering teams that have been successful in the NHL draft, the teams that come to mind intuitively support the findings of this analysis. The Chicago Blackhawks are a great example where their distinct strategy has been ‘quantity over quality.’ Rather than trying to pick ‘better,’ as has been shown to be very difficult to do, Chicago has simply focused on using transactions like these to draft as many players as possible. Chicago’s massive, league-leading number of picks from 2000-2004 show that the Hawks certainly planted their seeds – and in case anyone has been paying attention, they have been doing ‘OK’ in the last 5-10 years. Another great example of this strategy is Bill Belichick and the New England Patriots, who seem to have done alright in the last 10 or so years as well.


