


This article is being co-posted on Maple Leafs Hot Stove as well as on my own site, www.originalsixanalytics.com. Find me @OrgSixAnalytics on twitter.
Thus far in my Wins Above Replacement (WAR) ‘Explainer’ series, I have covered:
- Goals Above Replacement (GAR) & Player Evaluation, and
- Using GAR to Quantify Player Value & Salary Cap Efficiency
Now, for the final post in the series, I’d like to show how GAR can be applied to team-level decisions. First, I will show some analysis done by Moneypuck to demonstrate the relationship between GAR and standings points. Second, I will look at the 2014-2015 Chicago Blackhawks and Toronto Maple Leafs to show (i) a textbook example of using GAR to guide a team’s roster construction and salary cap management and (ii) what happens when a team ignores it altogether. Last, using the 2000-2015 Chicago Blackhawks as the best example of a modern ‘Model Franchise’, I will show how Brendan Shanahan’s Leafs’ organization seems to be borrowing a few pages from the Blackhawks’ playbook of the last decade.
Why GAR is Important for Roster Construction
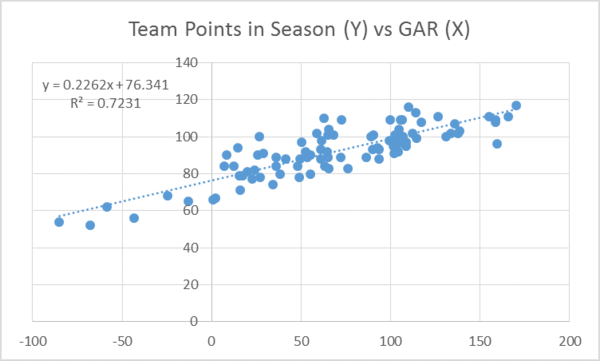
Last summer, Moneypuck did some excellent analysis where he demonstrated the very strong relationship between a team’s total GAR score and its points in the standings – even stronger than Corsi. I borrowed the chart below from Moneypuck’s analysis, showing how a team’s GAR score for a season on the x-axis can be a driver of its total points, on the y-axis.
Here is a summary of his findings:
- Based on the R2 above, GAR has the ability to predict roughly 72% of how a team will end up in the standings (retroactively).
- Using this equation, a team with a total GAR of zero – the same as a hypothetical ‘replacement level’ team – would score roughly 76 points in the standings.
- Adding players above/below replacement level to a team would conceptually ‘move’ that team’s expectations up or down the curve shown, based on that players’ GAR.
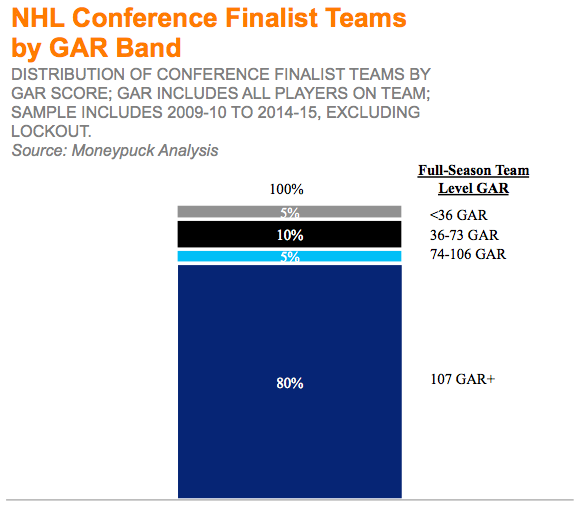
Moneypuck then split up all conference finalist teams since 2009 by GAR score, and had some pretty clear findings:
Note: All GAR data original ly comes from WAR-on-ice.com, and the contract information from later charts comes from Rob Vollman’s 2014-15 comprehensive stats database.
The chart above shows that, although Cinderella stories do take place, 80% of conference finalist teams have total GAR scores of 107 or more. This analysis can almost be said to define the ‘goal posts’ of how GAR can be used for roster construction.
Based on this, NHL GM’s could reasonably set a target of 107 GAR for their teams. In years where a team is forecasting close to 107 GAR, the GM should consider trading for those last 1-2 key pieces to make a run. If the team is well off of 107, the GM can instead use it to guide his long term plan by answering (i) how he can acquire a core group of players to reach 107 GAR, and (ii) once acquired, how can he best divide his cap space between those players in order to keep them?
Now that the goal posts are established, I will look at team-level cap efficiency and roster construction of our two example teams: the 2014-15 Blackhawks and Leafs, based on their season-end rosters.
Team-Level Salary Cap Efficiency
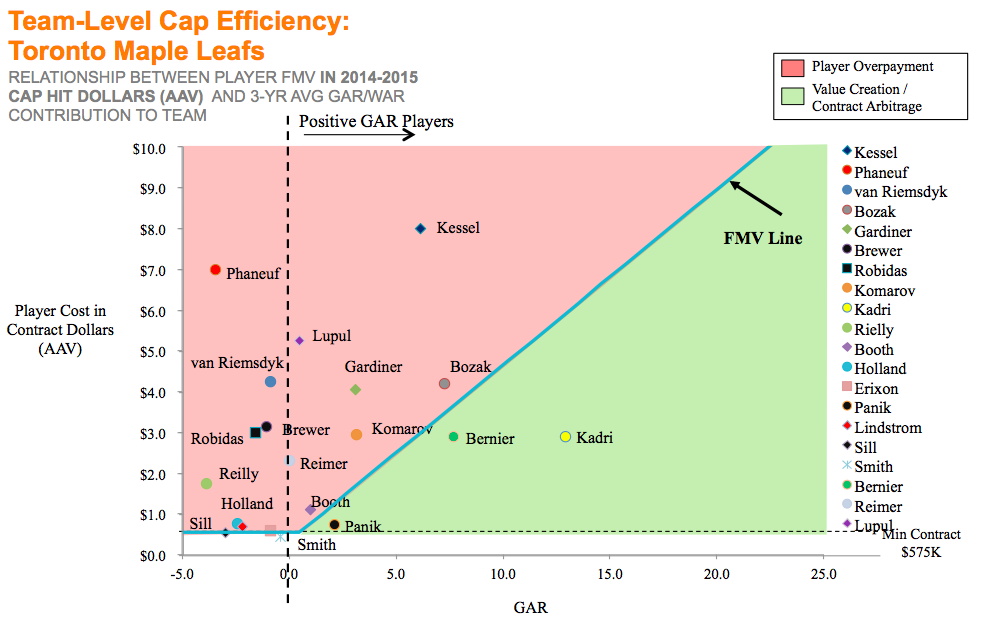
First, I will revisit the Cap Efficiency Curve from my last post, but for a whole team at once, rather than for just a single player. I encourage those who haven’t read my last two articles to go check them out, as it will provide the necessary context for the upcoming analysis.
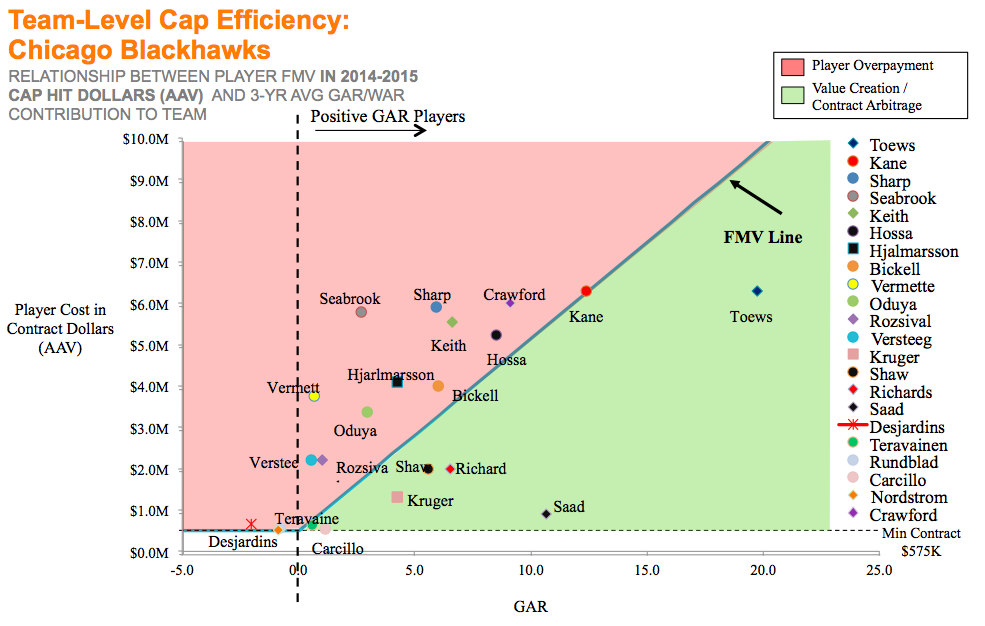
Looking at the above, you can observe the following:
- Almost all Chicago players are on or to the right of the ‘zero GAR’ line – that is, almost all have contributed more than replacement level.
- Relative to the Fair Market Value (FMV) line, Chicago has players both on value-creating and over-paying contracts.
- However, most players don’t stray too far from their FMVs; generally, the team slants upward and to the right, with the highest pay going to the greatest contributors.
- The most notable exceptions to this pattern are:
- Brent Seabrook, who has weaker shot-rate contributions than you would expect, a major driver of GAR.
- Jonathan Toews, who was in his last RFA year in 2014-2015 (which also explains the 2016 bump to 10.5M, shown in my last article).
- Brandon Saad, who was finishing his ELC in 2014-2015, was understandably traded to Columbus once he came due for a raise in the offseason; the Blue Jackets promptly signed him for 6 years at $6M per year.
Now – let’s compare this to the 2014-15 Leafs:
Here, you can make largely the opposite observations:
- Many Leafs players are on the wrong side of the zero GAR line, putting them below replacement level over this period.
- There are very few examples of players in the ‘green’ area of the chart, with only Kadri, Bernier and Panik having value-creating contracts.
- For what it is worth, this under-sells some players: e.g. Morgan Rielly is being dragged down here by his rookie and sophomore seasons, a time when few players will score well on GAR.
Value Creation / Overpayment by Individual Player
We can also look at this output as the actual dollar value created (or overpaid) for each individual player; similar to what I did for Toews, Phaneuf, Parenteau and Boyes previously. I calculate this by subtracting each player’s contracted AAV from the AAV of the FMV line, at the same GAR score. Green bars represent value being created for the team, while red bars represent value lost/overpaid to the player.
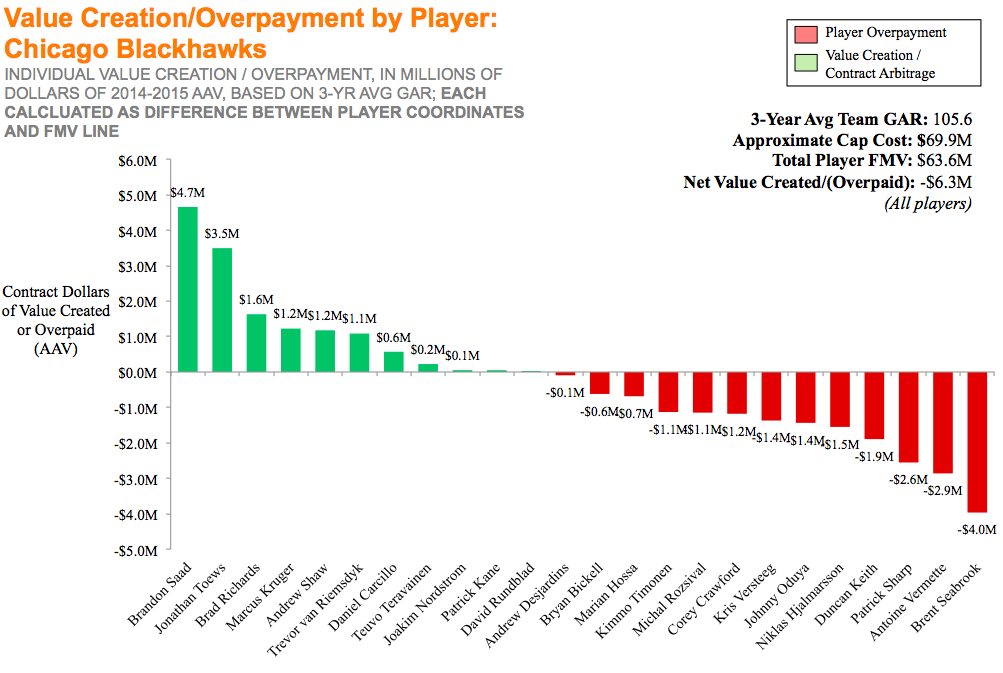
The Hawks’ results here are consistent with the earlier chart, where Saad, Toews and Seabrook were the most extreme examples in an otherwise balanced group. This chart also shows:
- The Hawk’s 3-year Avg Team GAR was 105.6 – just what you would expect of a conference finalist/Stanley-Cup winning team.
- The team’s net total value overpaid was $6.3M.
- This represents the approximate year-end cap hit of the Blackhawks at ~$69.9M(1), minus the total FMV of their players at $63.6M.
Although the Blackhawks slightly ‘overpaid’ their players according to this analysis, more broadly I think the Hawks were generally quite close to paying players the appropriate amount across the board.
However, what this result tells me is that a big part of effectively managing a roster will come down to simply not overpaying players. It is extremely hard to find a player that can be signed for less than he is worth, largely happening only when the player is drafted and held for all of his ELC/RFA years. As a result, the simplest way a team can effectively manage its salary cap is to be disciplined in contract negotiations, and avoid giving large contracts to high risk or potentially declining players.
Speaking of overpaying players…
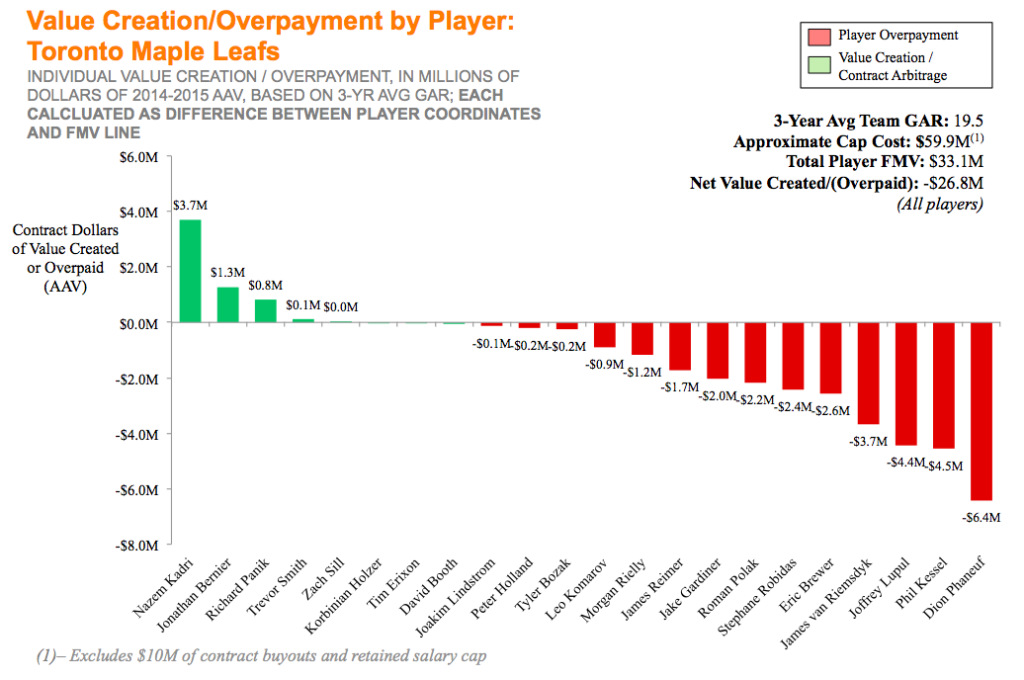
This chart shouldn’t need much explaining. Nazem Kadri is the sole shining light of the Leafs’ from last season, and Phaneuf was the largest contract drag they (previously) had on the books.
(Note: This was supposed to be based on season end roster but somehow guys like Holzer snuck in there)
Applying GAR Directly to Roster Construction
Last, I will look at how teams like the Blackhawks allocate cap space when constructing their rosters. Specifically, I will compare the percentage of the cap that each player receives in pay, as well as the percentage of the team’s GAR that each player contributes. Any team that is applying this type of thinking to its roster construction would ideally attempt to match these two percentages closely, so as not to ‘waste’ cap space on non-contributing players.
Not surprisingly, that is exactly what we see from the Blackhawks:
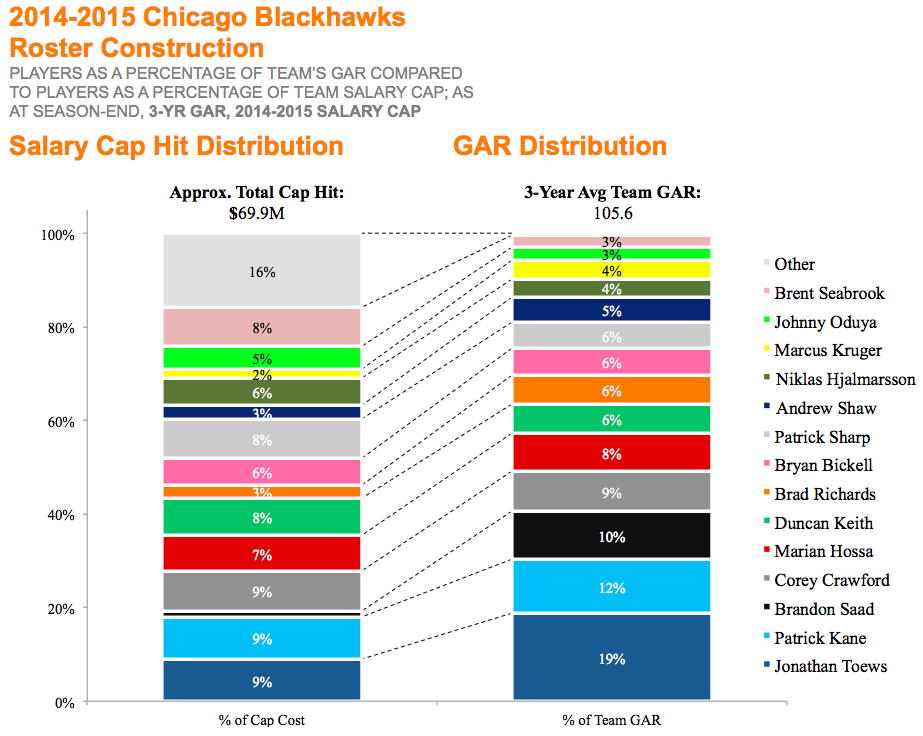
- The chart above shows a very interesting, and potentially deliberate, matching of a player’s GAR contribution and his portion of the cap earned.
- Many of the Blackhawks’ largest GAR contributors have slight greater GAR percentages than cap percentages — again suggesting the Hawks are getting good returns on their dollars.
- Last, this chart helps to show that the Blackhawks have constructed their roster around a ‘core’ set of 7-8 players that drive their results:
- This core consists largely of the team’s top four forwards, top three defensemen, and starting goalie (Toews, Kane, Hossa, Sharp, Keith, Seabrook, Hjalmarsson, and Crawford).
- These players collectively earn 64% of the salary cap, and contribute 67% of the team’s GAR.
- Interestingly, this directly matches the typical conference finalist team having ~8 or so 10+ GAR players, shown in Moneypuck’s analysis cited in my first article.
This chart is relatively clean and easy to read, in part due to how well the Hawk’s connect their cap hits to player’s GAR. The Leafs, unfortunately, had a lineup that was mixed between players with positive and negative GAR scores – making this type of analysis less clear and intuitive. To make up for this, I have split the Leafs’ team GAR chart into two sub-charts, one for each of the team’s positive GAR players and its negative GAR players, with each group separately totaling to 100%. Note: as a result, the percentages of the positive and negative bars are not directly comparable to each other.
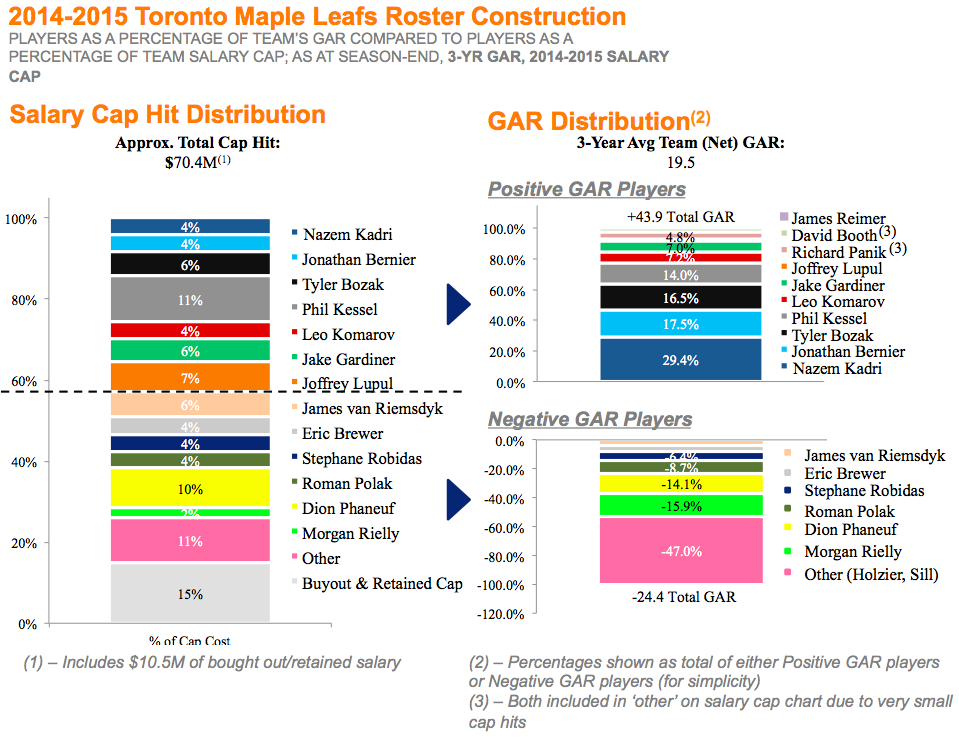
A couple comments:
- Almost 60% of the Leafs cap space was going to players who were contributing zero or negative GAR value to the team.
- 15% of this was also driven by their surprisingly high, non-contributing $10.5M of bought out and retained cap space.
- As mentioned, the Leafs’ net GAR score is 19.5, or the difference between positive GAR players of 43.9 and the negative players of -24.4.
- The Leafs ‘core’ players were simply not of the same calibre or ability to drive a team’s results as the core on the Hawks.
In the end, it is clear this type of analysis was not driving the roster construction decisions of the legacy Toronto Maple Leafs front offices. Instead, the lack of it helped to dig the giant salary cap hole that Shanahan inherited.
Building ‘The Model Franchise’ in Toronto
Although the Leafs entered 2015-16 in a difficult position, the last eight to ten months have given fans ongoing reasons to be optimistic about the future. As such, I will close out by touching on five major parallels between the 2000-2015 Chicago Blackhawks organization, and what Brandon Shanahan has begun to do to fulfill his vision of “returning an original six franchise to its rightful place in the league.”
1. Front Office & Coaching
Under GM Stan Bowman, head coach Joel Quenneville, and with a senior advisor of the winningest coach in NHL history, Scotty Bowman, the Chicago Blackhawks easily have one of the best front offices in the league. Over the last two years, Shanahan has done an unbelievable job putting together a team of arguably the same calibre: between Lou Lamoriello, Mike Babcock, Mark Hunter and Kyle Dubas, the Leafs’ have an equally all-star leadership team. It is also worth noting the similarity between Babock’s and Quenneville’s system-driven styles, which are both centered on driving puck possession.
2. Building Through the Draft: Quantity First
Between 2000 and 2004, the Chicago Blackhawks had the highest number of picks of any team in the league at 64, versus the next highest of 58 and a league average in that period of 48. This allowed them to pick up many core pieces they still have, long before Toews & Kane arrived (e.g. Keith (2nd round), Crawford (2nd round), or more recently, Saad (2nd round). As I discussed in a previous article, the Leafs are employing a similar strategy, both by maximizing the quantity of their picks and also by hopefully leveraging Mark Hunter’s strong scouting organization and network.
Separately, to the concept of ‘building a core 7-8 players’, many fans have enjoyed speculating that the Leafs’ major recent draft picks of Nylander, Marner, Rielly, Kadri, (as well as Gardiner, who they traded for) etc. will make up that group going forward. Only time will tell.
3. Investing in Player Development
Both teams focus on managing their organizations holistically, by working closely with all of NHL, AHL, and often ECHL rosters. Like Babock’s former Red Wings, both teams also push players to develop in the minors, with even two-time Norris Trophy winner Duncan Keith having spent two years in the AHL. The Leafs also lean on the Marlies to help young players learn the team’s system, and help the entire organization focus on every player’s development at both levels. Finally, building a large pipeline of young talent through the draft also allows both the Hawks and Leafs to hold those players on very beneficial contract terms for approximately seven seasons while players play through their ELC/RFA years.
4. Global Scouting & Free Agents
Finding elite talent is a very difficult task, and the most successful organizations leave no stone unturned. The way Chicago’s was able to pick up a first-line player like Artemi Panarin as a free agent signing (also currently on an ELC deal) is the NHL-equivalent of found money. Although Nikita Zaitsev will not necessarily be of the caliber of Panarin, if the media is right that Zaitsev plans to sign with the Leafs at seasons’ end, he will no doubt be a major player to land. The potential to pick up a developed, 24 year old potential top four defensemen provides even more strong evidence in support of investing in scouting around the globe.
5. Strategic Cap Management & Roster Construction
Last – although the analysis above shows Shanahan and company have inherited a very unfortunate roster situation, they are clearly doing the right things to slowly off-load anchor contracts, sign value-creating free agents and offload pending UFA contracts for future assets in picks and prospects. I think it is safe to say that two or three years from now, the Leafs’ roster and salary cap situation will look a lot more like that of the 2014-15 Chicago Blackhawks’ than it resembles the Toronto Maple Leafs team that Shanahan inherited.
Conclusion
With that, I will wrap up my ‘WAR Explainer’ Series – so thank you to those who have made it through all three parts. In it, I have covered (i) GAR & Player Evaluation, (ii) Player Value and Contract Efficiency, and (iii) GAR and Roster construction/Team-Level Cap Efficiency. Hopefully the series has also provided an interesting view into how the current Leafs’ organization is implementing these principles in their long term rebuild, and helped us all build our patience a little longer. Maybe, just maybe, 5-10 years from now fans will be looking back at the Shanahan-era Toronto Maple Leafs as the modern NHL’s next model franchise, to be emulated for years to come.


